
Hi, We are about to integrate in Pharo a new member of the Glamorous Toolkit: the GTDebugger. As this is a significant change that might affect your workflow, here is some background information to help you deal with the change. First, you should know that the change is not irreversible and it is easily possible to disabled the new debugger through a setting. However, please do take the time to provide us feedback if something does not work out for you. We want to know what can be improved and we try to react as fast as we can. A practical change comes from the fact that the variables are manipulated through a GTInspector, which makes it cheaper to maintain in the longer run. While the first thing that will capture the attention is the default generic interface, the real power comes from the moldable nature of the debugger. Like all other GT tools, GTDebugger is also moldable by design. This means that we can construct custom debuggers for specific libraries at small costs (often measured in a couple of hundred lines of code). For example, the core configuration includes also the SUnit and the bytecode debugger. These are around 150 lines of code. Here is how the bytecode debugger looks like: You can find more information in an introductory overview blog post that also includes some links for further reading: http://www.humane-assessment.com/blog/gtdebugger-in-pharo/ Please let us know what you think. Cheers, Doru -- www.tudorgirba.com www.feenk.com "What is more important: To be happy, or to make happy?"

does the GTDebugger respect the pharo themes support or is it like GTSpotter ? On Fri, Jan 8, 2016 at 1:08 PM Tudor Girba <tudor@tudorgirba.com> wrote:
Hi,
We are about to integrate in Pharo a new member of the Glamorous Toolkit: the GTDebugger. As this is a significant change that might affect your workflow, here is some background information to help you deal with the change.
First, you should know that the change is not irreversible and it is easily possible to disabled the new debugger through a setting. However, please do take the time to provide us feedback if something does not work out for you. We want to know what can be improved and we try to react as fast as we can.
A practical change comes from the fact that the variables are manipulated through a GTInspector, which makes it cheaper to maintain in the longer run.
While the first thing that will capture the attention is the default generic interface, the real power comes from the moldable nature of the debugger. Like all other GT tools, GTDebugger is also moldable by design. This means that we can construct custom debuggers for specific libraries at small costs (often measured in a couple of hundred lines of code).
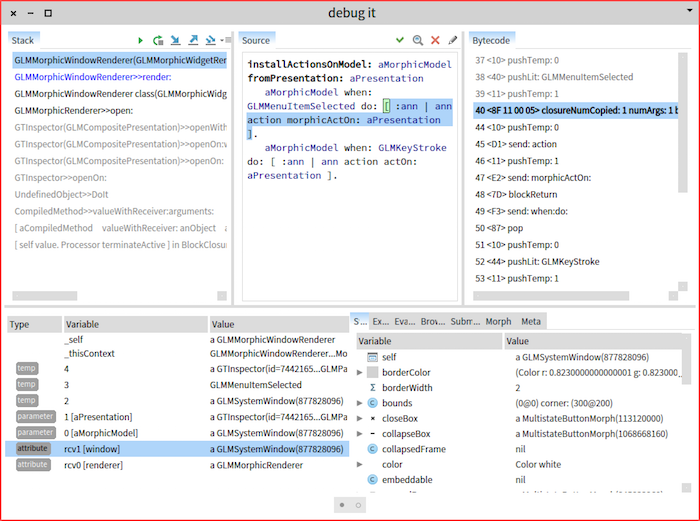
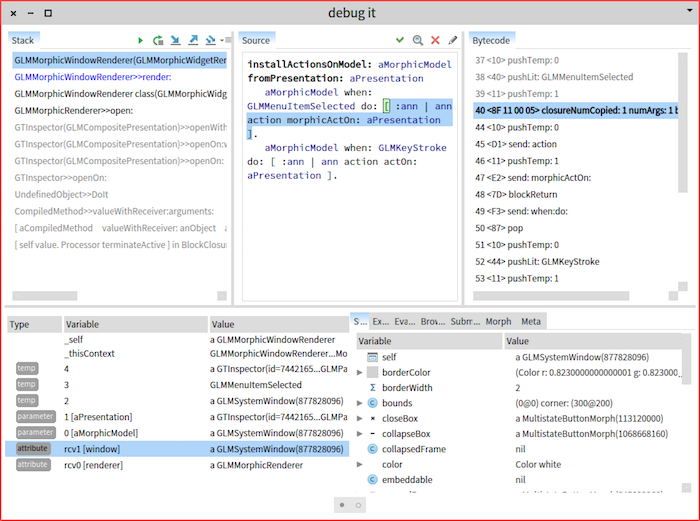
For example, the core configuration includes also the SUnit and the bytecode debugger. These are around 150 lines of code. Here is how the bytecode debugger looks like:
You can find more information in an introductory overview blog post that also includes some links for further reading:
http://www.humane-assessment.com/blog/gtdebugger-in-pharo/
Please let us know what you think.
Cheers, Doru
-- www.tudorgirba.com www.feenk.com
"What is more important: To be happy, or to make happy?"
_______________________________________________ Moose-dev mailing list Moose-dev@list.inf.unibe.ch https://www.list.inf.unibe.ch/listinfo/moose-dev

On Fri, Jan 8, 2016 at 2:09 PM, Dimitris Chloupis <kilon.alios@gmail.com> wrote:
does the GTDebugger respect the pharo themes support or is it like GTSpotter ?
It behaves just as GTInspector regrading the theme. Just if you are using a custom theme and want to have the coloring of the stack enabled you need to provide the appropriate colors in your theme (styleContext:from:) Cheers, Andrei
On Fri, Jan 8, 2016 at 1:08 PM Tudor Girba <tudor@tudorgirba.com> wrote:
Hi,
We are about to integrate in Pharo a new member of the Glamorous Toolkit: the GTDebugger. As this is a significant change that might affect your workflow, here is some background information to help you deal with the change.
First, you should know that the change is not irreversible and it is easily possible to disabled the new debugger through a setting. However, please do take the time to provide us feedback if something does not work out for you. We want to know what can be improved and we try to react as fast as we can.
A practical change comes from the fact that the variables are manipulated through a GTInspector, which makes it cheaper to maintain in the longer run.
While the first thing that will capture the attention is the default generic interface, the real power comes from the moldable nature of the debugger. Like all other GT tools, GTDebugger is also moldable by design. This means that we can construct custom debuggers for specific libraries at small costs (often measured in a couple of hundred lines of code).
For example, the core configuration includes also the SUnit and the bytecode debugger. These are around 150 lines of code. Here is how the bytecode debugger looks like:
You can find more information in an introductory overview blog post that also includes some links for further reading:
http://www.humane-assessment.com/blog/gtdebugger-in-pharo/
Please let us know what you think.
Cheers, Doru
-- www.tudorgirba.com www.feenk.com
"What is more important: To be happy, or to make happy?"
_______________________________________________ Moose-dev mailing list Moose-dev@list.inf.unibe.ch https://www.list.inf.unibe.ch/listinfo/moose-dev
_______________________________________________ Moose-dev mailing list Moose-dev@list.inf.unibe.ch https://www.list.inf.unibe.ch/listinfo/moose-dev
is there any documentation about this ? or i just look at the relevant classes ? On Fri, Jan 8, 2016 at 3:20 PM Andrei Chis <chisvasileandrei@gmail.com> wrote:
On Fri, Jan 8, 2016 at 2:09 PM, Dimitris Chloupis <kilon.alios@gmail.com> wrote:
does the GTDebugger respect the pharo themes support or is it like GTSpotter ?
It behaves just as GTInspector regrading the theme. Just if you are using a custom theme and want to have the coloring of the stack enabled you need to provide the appropriate colors in your theme (styleContext:from:)
Cheers, Andrei
On Fri, Jan 8, 2016 at 1:08 PM Tudor Girba <tudor@tudorgirba.com> wrote:
Hi,
We are about to integrate in Pharo a new member of the Glamorous Toolkit: the GTDebugger. As this is a significant change that might affect your workflow, here is some background information to help you deal with the change.
First, you should know that the change is not irreversible and it is easily possible to disabled the new debugger through a setting. However, please do take the time to provide us feedback if something does not work out for you. We want to know what can be improved and we try to react as fast as we can.
A practical change comes from the fact that the variables are manipulated through a GTInspector, which makes it cheaper to maintain in the longer run.
While the first thing that will capture the attention is the default generic interface, the real power comes from the moldable nature of the debugger. Like all other GT tools, GTDebugger is also moldable by design. This means that we can construct custom debuggers for specific libraries at small costs (often measured in a couple of hundred lines of code).
For example, the core configuration includes also the SUnit and the bytecode debugger. These are around 150 lines of code. Here is how the bytecode debugger looks like:
You can find more information in an introductory overview blog post that also includes some links for further reading:
http://www.humane-assessment.com/blog/gtdebugger-in-pharo/
Please let us know what you think.
Cheers, Doru
-- www.tudorgirba.com www.feenk.com
"What is more important: To be happy, or to make happy?"
_______________________________________________ Moose-dev mailing list Moose-dev@list.inf.unibe.ch https://www.list.inf.unibe.ch/listinfo/moose-dev
_______________________________________________ Moose-dev mailing list Moose-dev@list.inf.unibe.ch https://www.list.inf.unibe.ch/listinfo/moose-dev
_______________________________________________
Moose-dev mailing list Moose-dev@list.inf.unibe.ch https://www.list.inf.unibe.ch/listinfo/moose-dev
On Fri, Jan 8, 2016 at 2:23 PM, Dimitris Chloupis <kilon.alios@gmail.com> wrote:
is there any documentation about this ? or i just look at the relevant classes ?
Not really. Now you'll need to look in UITheme>>styleContext:from:, but I'll refactor that method shortly.
On Fri, Jan 8, 2016 at 3:20 PM Andrei Chis <chisvasileandrei@gmail.com> wrote:
On Fri, Jan 8, 2016 at 2:09 PM, Dimitris Chloupis <kilon.alios@gmail.com> wrote:
does the GTDebugger respect the pharo themes support or is it like GTSpotter ?
It behaves just as GTInspector regrading the theme. Just if you are using a custom theme and want to have the coloring of the stack enabled you need to provide the appropriate colors in your theme (styleContext:from:)
Cheers, Andrei
On Fri, Jan 8, 2016 at 1:08 PM Tudor Girba <tudor@tudorgirba.com> wrote:
Hi,
We are about to integrate in Pharo a new member of the Glamorous Toolkit: the GTDebugger. As this is a significant change that might affect your workflow, here is some background information to help you deal with the change.
First, you should know that the change is not irreversible and it is easily possible to disabled the new debugger through a setting. However, please do take the time to provide us feedback if something does not work out for you. We want to know what can be improved and we try to react as fast as we can.
A practical change comes from the fact that the variables are manipulated through a GTInspector, which makes it cheaper to maintain in the longer run.
While the first thing that will capture the attention is the default generic interface, the real power comes from the moldable nature of the debugger. Like all other GT tools, GTDebugger is also moldable by design. This means that we can construct custom debuggers for specific libraries at small costs (often measured in a couple of hundred lines of code).
For example, the core configuration includes also the SUnit and the bytecode debugger. These are around 150 lines of code. Here is how the bytecode debugger looks like:
You can find more information in an introductory overview blog post that also includes some links for further reading:
http://www.humane-assessment.com/blog/gtdebugger-in-pharo/
Please let us know what you think.
Cheers, Doru
-- www.tudorgirba.com www.feenk.com
"What is more important: To be happy, or to make happy?"
_______________________________________________ Moose-dev mailing list Moose-dev@list.inf.unibe.ch https://www.list.inf.unibe.ch/listinfo/moose-dev
_______________________________________________ Moose-dev mailing list Moose-dev@list.inf.unibe.ch https://www.list.inf.unibe.ch/listinfo/moose-dev
_______________________________________________
Moose-dev mailing list Moose-dev@list.inf.unibe.ch https://www.list.inf.unibe.ch/listinfo/moose-dev

This is an excellent news! I have been waiting for that for long! go go go! Alexandre -- _,.;:~^~:;._,.;:~^~:;._,.;:~^~:;._,.;:~^~:;._,.;: Alexandre Bergel http://www.bergel.eu ^~:;._,.;:~^~:;._,.;:~^~:;._,.;:~^~:;._,.;:~^~:;.
On Jan 8, 2016, at 8:07 AM, Tudor Girba <tudor@tudorgirba.com> wrote:
Hi,
We are about to integrate in Pharo a new member of the Glamorous Toolkit: the GTDebugger. As this is a significant change that might affect your workflow, here is some background information to help you deal with the change.
First, you should know that the change is not irreversible and it is easily possible to disabled the new debugger through a setting. However, please do take the time to provide us feedback if something does not work out for you. We want to know what can be improved and we try to react as fast as we can.
A practical change comes from the fact that the variables are manipulated through a GTInspector, which makes it cheaper to maintain in the longer run.
While the first thing that will capture the attention is the default generic interface, the real power comes from the moldable nature of the debugger. Like all other GT tools, GTDebugger is also moldable by design. This means that we can construct custom debuggers for specific libraries at small costs (often measured in a couple of hundred lines of code).
For example, the core configuration includes also the SUnit and the bytecode debugger. These are around 150 lines of code. Here is how the bytecode debugger looks like:
<bytecode.png>
You can find more information in an introductory overview blog post that also includes some links for further reading: http://www.humane-assessment.com/blog/gtdebugger-in-pharo/ <http://www.humane-assessment.com/blog/gtdebugger-in-pharo/>
Please let us know what you think.
Cheers, Doru
-- www.tudorgirba.com <http://www.tudorgirba.com/> www.feenk.com
"What is more important: To be happy, or to make happy?"

I'm sorry but this debugger should not be the default one. MONDAY we are filming our mooc and we have to explain the debugger and personally I do not see the gain: - It looks a lot more complex to me and I do not want to have to redo all the screenshots of our lecture. - Just that I have to learn the meaning of small icons. - Why do we need a special pane for the evaluator - Why there is a type column. - Sorry but I'm not convinced about the moldable aspect behind the story (no need to argue I know it) I would like to avoid to be forced to use not the latest version of Pharo for the mooc. Such changes are arriving far too late in the release. We do not change the debugger itself the day of code freeze. We decided that the GTDebugger can be included but to me it never meant that it should be the default one. I think that experts can choose the debugger they want. The newbies don't. Stef

On Sat, Jan 9, 2016 at 4:22 AM, stepharo <stepharo@free.fr> wrote:
I'm sorry but this debugger should not be the default one. MONDAY we are filming our mooc and we have to explain the debugger and personally I do not see the gain: - It looks a lot more complex to me and I do not want to have to redo all the screenshots of our lecture. - Just that I have to learn the meaning of small icons. - Why do we need a special pane for the evaluator - Why there is a type column. - Sorry but I'm not convinced about the moldable aspect behind the story (no need to argue I know it)
This also applies to UPBE. It would be good to get that out the door matching Pharo 5 without too much rework. cheers -ben
I would like to avoid to be forced to use not the latest version of Pharo for the mooc.
Such changes are arriving far too late in the release. We do not change the debugger itself the day of code freeze.
We decided that the GTDebugger can be included but to me it never meant that it should be the default one. I think that experts can choose the debugger they want. The newbies don't.
Stef
Since I am the mainn maintainer of UPBE and pretty much alone, I will have to disagree, I have expressed my dislike for GT tools in the past, I was quite vocal about my dislike about GTPlayground and especially the pages interface of GTInspector. Yet even though I am the one that usually ends up keep pushing UPBE forward the most, I never said dont include this GT tool because I will have to document it. As a matter of fact GT people are the rare breed of pharoers , close to extinction level, that bothers documenting its own tools making my job super easy and a matter of porting their blog posts to Pillar. Also its important to note here that our dear beloved debugger is decades old, maybe just maybe its time to try something new even if we dont like it. Afterall GT people were quick to adress my problems of Playground like the lack of copy paste in right click menu, the lack of tabs etc. We objected and criticised, they improved . End of story. None complains about the Playground anymore. Its also important to note that they constantly pushing pharo forward. On the matters of documentation I will accept zero excuses from this community. If one spent 10 minutes per week, I repeat 10 minutes per week, on contributing to UPBE we would have the following 1) a person even a slow typer, types at least 40 words per minute 2) in 10 minutes one can type 400 words 3) That is one page of UPBE (pdf version) in 10 minutes 4) thats 50 pages per year per person 5) if people who are experienced are at least 10, I think we can find 10 people who understand pharo deeply , thats 500 pages per year we end up with the conclusion that the UPBE with extremely limited effort and extremely low amount of people would have by now the last 7 years that Pharo is around , 3500 pages of documentation. But since 10 people is too few and there a lot more judging from the mailing list , I will say 100 people is more realistic which means 35.000 pages or to put it more in perspective , thats the total of 10 UPBE books *I repeat 10 UPBE BOOKS !!!!! * So no no no and NO dont exclude the new debugger because of the effort to document, I respect Stef he and Damien are the ones responsible for the existenve of UPBE and PBE in the first place, they also helped me alot with Dimitri to port many chapters to pharo 4. Plus I love Pillar for documentation its awesome even with its flaws. But I say that GT people earned my trust, my trust that the have desire and visions to push Pharo forward and I say let them put the Debugger in who is going to hurt , it can be disabled and bring back the old one. Same story with Playground but seriously who bring back the old workspace ? Let them take the criticism and improve the new debugger, its a new thing of course it will have its flaws. But I dont want a Pharo that works well, I want a Pharo that keeps going forward. I have not the opportunity to download a new image because of my lack my connection is down and I use my mobile connection to do the minimum because it costs too much. But even if I heavily dislike the debugger like I did the the Playground I know that GT people will listen and will improve it, for that I have zero doubts because I admire their efforts even when I disagree with them. On Sat, Jan 9, 2016 at 4:19 AM Ben Coman <btc@openinworld.com> wrote:
On Sat, Jan 9, 2016 at 4:22 AM, stepharo <stepharo@free.fr> wrote:
I'm sorry but this debugger should not be the default one. MONDAY we are filming our mooc and we have to explain the debugger and personally I do not see the gain: - It looks a lot more complex to me and I do not want to have to redo all the screenshots of our lecture. - Just that I have to learn the meaning of small icons. - Why do we need a special pane for the evaluator - Why there is a type column. - Sorry but I'm not convinced about the moldable aspect behind the story (no need to argue I know it)
This also applies to UPBE. It would be good to get that out the door matching Pharo 5 without too much rework.
cheers -ben
I would like to avoid to be forced to use not the latest version of Pharo for the mooc.
Such changes are arriving far too late in the release. We do not change the debugger itself the day of code freeze.
We decided that the GTDebugger can be included but to me it never meant that it should be the default one. I think that experts can choose the debugger they want. The newbies don't.
Stef
Bad math, the correct is 35.000 word are: *I repeat 100 UPBE BOOKS !!!!! * On Sat, Jan 9, 2016 at 11:49 AM Dimitris Chloupis <kilon.alios@gmail.com> wrote:
Since I am the mainn maintainer of UPBE and pretty much alone, I will have to disagree, I have expressed my dislike for GT tools in the past, I was quite vocal about my dislike about GTPlayground and especially the pages interface of GTInspector.
Yet even though I am the one that usually ends up keep pushing UPBE forward the most, I never said dont include this GT tool because I will have to document it.
As a matter of fact GT people are the rare breed of pharoers , close to extinction level, that bothers documenting its own tools making my job super easy and a matter of porting their blog posts to Pillar.
Also its important to note here that our dear beloved debugger is decades old, maybe just maybe its time to try something new even if we dont like it.
Afterall GT people were quick to adress my problems of Playground like the lack of copy paste in right click menu, the lack of tabs etc. We objected and criticised, they improved . End of story. None complains about the Playground anymore.
Its also important to note that they constantly pushing pharo forward.
On the matters of documentation I will accept zero excuses from this community. If one spent 10 minutes per week, I repeat 10 minutes per week, on contributing to UPBE we would have the following
1) a person even a slow typer, types at least 40 words per minute 2) in 10 minutes one can type 400 words 3) That is one page of UPBE (pdf version) in 10 minutes 4) thats 50 pages per year per person 5) if people who are experienced are at least 10, I think we can find 10 people who understand pharo deeply , thats 500 pages per year
we end up with the conclusion that the UPBE with extremely limited effort and extremely low amount of people would have by now the last 7 years that Pharo is around , 3500 pages of documentation.
But since 10 people is too few and there a lot more judging from the mailing list , I will say 100 people is more realistic which means 35.000 pages or to put it more in perspective , thats the total of 10 UPBE books
*I repeat 10 UPBE BOOKS !!!!! * So no no no and NO dont exclude the new debugger because of the effort to document, I respect Stef he and Damien are the ones responsible for the existenve of UPBE and PBE in the first place, they also helped me alot with Dimitri to port many chapters to pharo 4. Plus I love Pillar for documentation its awesome even with its flaws.
But I say that GT people earned my trust, my trust that the have desire and visions to push Pharo forward and I say let them put the Debugger in who is going to hurt , it can be disabled and bring back the old one. Same story with Playground but seriously who bring back the old workspace ?
Let them take the criticism and improve the new debugger, its a new thing of course it will have its flaws. But I dont want a Pharo that works well, I want a Pharo that keeps going forward.
I have not the opportunity to download a new image because of my lack my connection is down and I use my mobile connection to do the minimum because it costs too much.
But even if I heavily dislike the debugger like I did the the Playground I know that GT people will listen and will improve it, for that I have zero doubts because I admire their efforts even when I disagree with them.
On Sat, Jan 9, 2016 at 4:19 AM Ben Coman <btc@openinworld.com> wrote:
On Sat, Jan 9, 2016 at 4:22 AM, stepharo <stepharo@free.fr> wrote:
I'm sorry but this debugger should not be the default one. MONDAY we are filming our mooc and we have to explain the debugger and personally I do not see the gain: - It looks a lot more complex to me and I do not want to have to redo all the screenshots of our lecture. - Just that I have to learn the meaning of small icons. - Why do we need a special pane for the evaluator - Why there is a type column. - Sorry but I'm not convinced about the moldable aspect behind the story (no need to argue I know it)
This also applies to UPBE. It would be good to get that out the door matching Pharo 5 without too much rework.
cheers -ben
I would like to avoid to be forced to use not the latest version of Pharo for the mooc.
Such changes are arriving far too late in the release. We do not change the debugger itself the day of code freeze.
We decided that the GTDebugger can be included but to me it never meant that it should be the default one. I think that experts can choose the debugger they want. The newbies don't.
Stef

No one said, dont integrale it. Just not yet as the default Debugger. Am 09.01.2016 10:51 vorm. schrieb "Dimitris Chloupis" <kilon.alios@gmail.com
:
Since I am the mainn maintainer of UPBE and pretty much alone, I will have to disagree, I have expressed my dislike for GT tools in the past, I was quite vocal about my dislike about GTPlayground and especially the pages interface of GTInspector.
Yet even though I am the one that usually ends up keep pushing UPBE forward the most, I never said dont include this GT tool because I will have to document it.
As a matter of fact GT people are the rare breed of pharoers , close to extinction level, that bothers documenting its own tools making my job super easy and a matter of porting their blog posts to Pillar.
Also its important to note here that our dear beloved debugger is decades old, maybe just maybe its time to try something new even if we dont like it.
Afterall GT people were quick to adress my problems of Playground like the lack of copy paste in right click menu, the lack of tabs etc. We objected and criticised, they improved . End of story. None complains about the Playground anymore.
Its also important to note that they constantly pushing pharo forward.
On the matters of documentation I will accept zero excuses from this community. If one spent 10 minutes per week, I repeat 10 minutes per week, on contributing to UPBE we would have the following
1) a person even a slow typer, types at least 40 words per minute 2) in 10 minutes one can type 400 words 3) That is one page of UPBE (pdf version) in 10 minutes 4) thats 50 pages per year per person 5) if people who are experienced are at least 10, I think we can find 10 people who understand pharo deeply , thats 500 pages per year
we end up with the conclusion that the UPBE with extremely limited effort and extremely low amount of people would have by now the last 7 years that Pharo is around , 3500 pages of documentation.
But since 10 people is too few and there a lot more judging from the mailing list , I will say 100 people is more realistic which means 35.000 pages or to put it more in perspective , thats the total of 10 UPBE books
I repeat 10 UPBE BOOKS !!!!!
So no no no and NO dont exclude the new debugger because of the effort to document, I respect Stef he and Damien are the ones responsible for the existenve of UPBE and PBE in the first place, they also helped me alot with Dimitri to port many chapters to pharo 4. Plus I love Pillar for documentation its awesome even with its flaws.
But I say that GT people earned my trust, my trust that the have desire and visions to push Pharo forward and I say let them put the Debugger in who is going to hurt , it can be disabled and bring back the old one. Same story with Playground but seriously who bring back the old workspace ?
Let them take the criticism and improve the new debugger, its a new thing of course it will have its flaws. But I dont want a Pharo that works well, I want a Pharo that keeps going forward.
I have not the opportunity to download a new image because of my lack my connection is down and I use my mobile connection to do the minimum because it costs too much.
But even if I heavily dislike the debugger like I did the the Playground I know that GT people will listen and will improve it, for that I have zero doubts because I admire their efforts even when I disagree with them.
On Sat, Jan 9, 2016 at 4:19 AM Ben Coman <btc@openinworld.com> wrote:
On Sat, Jan 9, 2016 at 4:22 AM, stepharo <stepharo@free.fr> wrote:
I'm sorry but this debugger should not be the default one. MONDAY we are filming our mooc and we have to explain the debugger and personally I do not see the gain: - It looks a lot more complex to me and I do not want to have to
redo
all the screenshots of our lecture. - Just that I have to learn the meaning of small icons. - Why do we need a special pane for the evaluator - Why there is a type column. - Sorry but I'm not convinced about the moldable aspect behind the story (no need to argue I know it)
This also applies to UPBE. It would be good to get that out the door matching Pharo 5 without too much rework.
cheers -ben
I would like to avoid to be forced to use not the latest version of Pharo for the mooc.
Such changes are arriving far too late in the release. We do not change the debugger itself the day of code freeze.
We decided that the GTDebugger can be included but to me it never meant that it should be the default one. I think that experts can choose the debugger they want. The newbies don't.
Stef

Thanks for this wonderfully positive message !! That is the spirit.
On 09 Jan 2016, at 10:49, Dimitris Chloupis <kilon.alios@gmail.com> wrote:
Since I am the mainn maintainer of UPBE and pretty much alone, I will have to disagree, I have expressed my dislike for GT tools in the past, I was quite vocal about my dislike about GTPlayground and especially the pages interface of GTInspector.
Yet even though I am the one that usually ends up keep pushing UPBE forward the most, I never said dont include this GT tool because I will have to document it.
As a matter of fact GT people are the rare breed of pharoers , close to extinction level, that bothers documenting its own tools making my job super easy and a matter of porting their blog posts to Pillar.
Also its important to note here that our dear beloved debugger is decades old, maybe just maybe its time to try something new even if we dont like it.
Afterall GT people were quick to adress my problems of Playground like the lack of copy paste in right click menu, the lack of tabs etc. We objected and criticised, they improved . End of story. None complains about the Playground anymore.
Its also important to note that they constantly pushing pharo forward.
On the matters of documentation I will accept zero excuses from this community. If one spent 10 minutes per week, I repeat 10 minutes per week, on contributing to UPBE we would have the following
1) a person even a slow typer, types at least 40 words per minute 2) in 10 minutes one can type 400 words 3) That is one page of UPBE (pdf version) in 10 minutes 4) thats 50 pages per year per person 5) if people who are experienced are at least 10, I think we can find 10 people who understand pharo deeply , thats 500 pages per year
we end up with the conclusion that the UPBE with extremely limited effort and extremely low amount of people would have by now the last 7 years that Pharo is around , 3500 pages of documentation.
But since 10 people is too few and there a lot more judging from the mailing list , I will say 100 people is more realistic which means 35.000 pages or to put it more in perspective , thats the total of 10 UPBE books
I repeat 10 UPBE BOOKS !!!!!
So no no no and NO dont exclude the new debugger because of the effort to document, I respect Stef he and Damien are the ones responsible for the existenve of UPBE and PBE in the first place, they also helped me alot with Dimitri to port many chapters to pharo 4. Plus I love Pillar for documentation its awesome even with its flaws.
But I say that GT people earned my trust, my trust that the have desire and visions to push Pharo forward and I say let them put the Debugger in who is going to hurt , it can be disabled and bring back the old one. Same story with Playground but seriously who bring back the old workspace ?
Let them take the criticism and improve the new debugger, its a new thing of course it will have its flaws. But I dont want a Pharo that works well, I want a Pharo that keeps going forward.
I have not the opportunity to download a new image because of my lack my connection is down and I use my mobile connection to do the minimum because it costs too much.
But even if I heavily dislike the debugger like I did the the Playground I know that GT people will listen and will improve it, for that I have zero doubts because I admire their efforts even when I disagree with them.
On Sat, Jan 9, 2016 at 4:19 AM Ben Coman <btc@openinworld.com> wrote: On Sat, Jan 9, 2016 at 4:22 AM, stepharo <stepharo@free.fr> wrote:
I'm sorry but this debugger should not be the default one. MONDAY we are filming our mooc and we have to explain the debugger and personally I do not see the gain: - It looks a lot more complex to me and I do not want to have to redo all the screenshots of our lecture. - Just that I have to learn the meaning of small icons. - Why do we need a special pane for the evaluator - Why there is a type column. - Sorry but I'm not convinced about the moldable aspect behind the story (no need to argue I know it)
This also applies to UPBE. It would be good to get that out the door matching Pharo 5 without too much rework.
cheers -ben
I would like to avoid to be forced to use not the latest version of Pharo for the mooc.
Such changes are arriving far too late in the release. We do not change the debugger itself the day of code freeze.
We decided that the GTDebugger can be included but to me it never meant that it should be the default one. I think that experts can choose the debugger they want. The newbies don't.
Stef
Thank you, indeed. Doru
On Jan 9, 2016, at 1:23 PM, Sven Van Caekenberghe <sven@stfx.eu> wrote:
Thanks for this wonderfully positive message !! That is the spirit.
On 09 Jan 2016, at 10:49, Dimitris Chloupis <kilon.alios@gmail.com> wrote:
Since I am the mainn maintainer of UPBE and pretty much alone, I will have to disagree, I have expressed my dislike for GT tools in the past, I was quite vocal about my dislike about GTPlayground and especially the pages interface of GTInspector.
Yet even though I am the one that usually ends up keep pushing UPBE forward the most, I never said dont include this GT tool because I will have to document it.
As a matter of fact GT people are the rare breed of pharoers , close to extinction level, that bothers documenting its own tools making my job super easy and a matter of porting their blog posts to Pillar.
Also its important to note here that our dear beloved debugger is decades old, maybe just maybe its time to try something new even if we dont like it.
Afterall GT people were quick to adress my problems of Playground like the lack of copy paste in right click menu, the lack of tabs etc. We objected and criticised, they improved . End of story. None complains about the Playground anymore.
Its also important to note that they constantly pushing pharo forward.
On the matters of documentation I will accept zero excuses from this community. If one spent 10 minutes per week, I repeat 10 minutes per week, on contributing to UPBE we would have the following
1) a person even a slow typer, types at least 40 words per minute 2) in 10 minutes one can type 400 words 3) That is one page of UPBE (pdf version) in 10 minutes 4) thats 50 pages per year per person 5) if people who are experienced are at least 10, I think we can find 10 people who understand pharo deeply , thats 500 pages per year
we end up with the conclusion that the UPBE with extremely limited effort and extremely low amount of people would have by now the last 7 years that Pharo is around , 3500 pages of documentation.
But since 10 people is too few and there a lot more judging from the mailing list , I will say 100 people is more realistic which means 35.000 pages or to put it more in perspective , thats the total of 10 UPBE books
I repeat 10 UPBE BOOKS !!!!!
So no no no and NO dont exclude the new debugger because of the effort to document, I respect Stef he and Damien are the ones responsible for the existenve of UPBE and PBE in the first place, they also helped me alot with Dimitri to port many chapters to pharo 4. Plus I love Pillar for documentation its awesome even with its flaws.
But I say that GT people earned my trust, my trust that the have desire and visions to push Pharo forward and I say let them put the Debugger in who is going to hurt , it can be disabled and bring back the old one. Same story with Playground but seriously who bring back the old workspace ?
Let them take the criticism and improve the new debugger, its a new thing of course it will have its flaws. But I dont want a Pharo that works well, I want a Pharo that keeps going forward.
I have not the opportunity to download a new image because of my lack my connection is down and I use my mobile connection to do the minimum because it costs too much.
But even if I heavily dislike the debugger like I did the the Playground I know that GT people will listen and will improve it, for that I have zero doubts because I admire their efforts even when I disagree with them.
On Sat, Jan 9, 2016 at 4:19 AM Ben Coman <btc@openinworld.com> wrote: On Sat, Jan 9, 2016 at 4:22 AM, stepharo <stepharo@free.fr> wrote:
I'm sorry but this debugger should not be the default one. MONDAY we are filming our mooc and we have to explain the debugger and personally I do not see the gain: - It looks a lot more complex to me and I do not want to have to redo all the screenshots of our lecture. - Just that I have to learn the meaning of small icons. - Why do we need a special pane for the evaluator - Why there is a type column. - Sorry but I'm not convinced about the moldable aspect behind the story (no need to argue I know it)
This also applies to UPBE. It would be good to get that out the door matching Pharo 5 without too much rework.
cheers -ben
I would like to avoid to be forced to use not the latest version of Pharo for the mooc.
Such changes are arriving far too late in the release. We do not change the debugger itself the day of code freeze.
We decided that the GTDebugger can be included but to me it never meant that it should be the default one. I think that experts can choose the debugger they want. The newbies don't.
Stef
-- www.tudorgirba.com www.feenk.com "We cannot reach the flow of things unless we let go."

Le 08/01/2016 21:22, stepharo a écrit :
I'm sorry but this debugger should not be the default one. MONDAY we are filming our mooc and we have to explain the debugger and personally I do not see the gain: - It looks a lot more complex to me and I do not want to have to redo all the screenshots of our lecture. - Just that I have to learn the meaning of small icons. - Why do we need a special pane for the evaluator - Why there is a type column. - Sorry but I'm not convinced about the moldable aspect behind the story (no need to argue I know it)
I would like to avoid to be forced to use not the latest version of Pharo for the mooc.
Such changes are arriving far too late in the release. We do not change the debugger itself the day of code freeze.
We decided that the GTDebugger can be included but to me it never meant that it should be the default one. I think that experts can choose the debugger they want. The newbies don't.
Stef
IMO the old debugger is way more intuitive. When I used the debugger of Eclipse for java I was lost. When I used Spec debugger I thought "Oh, this is not so hard in fact". And I lose the feeling with GTDebugger. And the debugger is one of the main source of interest for newbies. Maybe we could have a button on the spec Debugger "Switch to GTDebugger"? -- Cyril Ferlicot http://www.synectique.eu 165 Avenue Bretagne Lille 59000 France
Thanks for your testimony. I'm not against GTDebugger per se. I believe that we should have better tools but we should take time for building better tools (even if this is two years that moosers use or not this new debugger). I would appreciate a process where users can give real feedback and we can simplify/shape our tools nicely. Now for the mooc I will not present GTDebugger. So students will not use Pharo 50 Stef
Le 08/01/2016 21:22, stepharo a écrit :
I'm sorry but this debugger should not be the default one. MONDAY we are filming our mooc and we have to explain the debugger and personally I do not see the gain: - It looks a lot more complex to me and I do not want to have to redo all the screenshots of our lecture. - Just that I have to learn the meaning of small icons. - Why do we need a special pane for the evaluator - Why there is a type column. - Sorry but I'm not convinced about the moldable aspect behind the story (no need to argue I know it)
I would like to avoid to be forced to use not the latest version of Pharo for the mooc.
Such changes are arriving far too late in the release. We do not change the debugger itself the day of code freeze.
We decided that the GTDebugger can be included but to me it never meant that it should be the default one. I think that experts can choose the debugger they want. The newbies don't.
Stef
IMO the old debugger is way more intuitive. When I used the debugger of Eclipse for java I was lost. When I used Spec debugger I thought "Oh, this is not so hard in fact". And I lose the feeling with GTDebugger. And the debugger is one of the main source of interest for newbies.
Maybe we could have a button on the spec Debugger "Switch to GTDebugger"?

(re-send because I exceeded limit.) Hi, letâs think positive. the GTDebugger is a step forward⦠it allow a lot of better interactions and of course, it needs some iterations to make it appealing to everybody. For instance, I took me 2â to tweak the debugger presentation and to get this: (I changed all available⦠is a trivial task) and like IMO feels a lot better⦠and I think is a good compromise between the old and the new. Reasons to suggest this approach: - it keeps old approach who(I think) was good (I can see the stack, and the flow feels natural from top to down) - it preserves âthe importantâ (the code) as central. - it gives space for adding columns (like the bytecode). Now⦠I can understand you want icons with text, and that can be hacked too⦠So⦠can we have an agreement? Esteban ps: btw⦠using GT with Fast Table we can also avoid those annoying paginated lists too
On 09 Jan 2016, at 08:53, stepharo <stepharo@free.fr> wrote:
Thanks for your testimony.
I'm not against GTDebugger per se. I believe that we should have better tools but we should take time for building better tools (even if this is two years that moosers use or not this new debugger). I would appreciate a process where users can give real feedback and we can simplify/shape our tools nicely.
Now for the mooc I will not present GTDebugger. So students will not use Pharo 50
Stef
Le 08/01/2016 21:22, stepharo a écrit :
I'm sorry but this debugger should not be the default one. MONDAY we are filming our mooc and we have to explain the debugger and personally I do not see the gain: - It looks a lot more complex to me and I do not want to have to redo all the screenshots of our lecture. - Just that I have to learn the meaning of small icons. - Why do we need a special pane for the evaluator - Why there is a type column. - Sorry but I'm not convinced about the moldable aspect behind the story (no need to argue I know it)
I would like to avoid to be forced to use not the latest version of Pharo for the mooc.
Such changes are arriving far too late in the release. We do not change the debugger itself the day of code freeze.
We decided that the GTDebugger can be included but to me it never meant that it should be the default one. I think that experts can choose the debugger they want. The newbies don't.
Stef
IMO the old debugger is way more intuitive. When I used the debugger of Eclipse for java I was lost. When I used Spec debugger I thought "Oh, this is not so hard in fact". And I lose the feeling with GTDebugger. And the debugger is one of the main source of interest for newbies.
Maybe we could have a button on the spec Debugger "Switch to GTDebugger"?
Hi,
On Jan 9, 2016, at 10:43 AM, Esteban Lorenzano <estebanlm@gmail.com> wrote:
(re-send because I exceeded limit.)
Hi,
letâs think positive.
Thanks :)
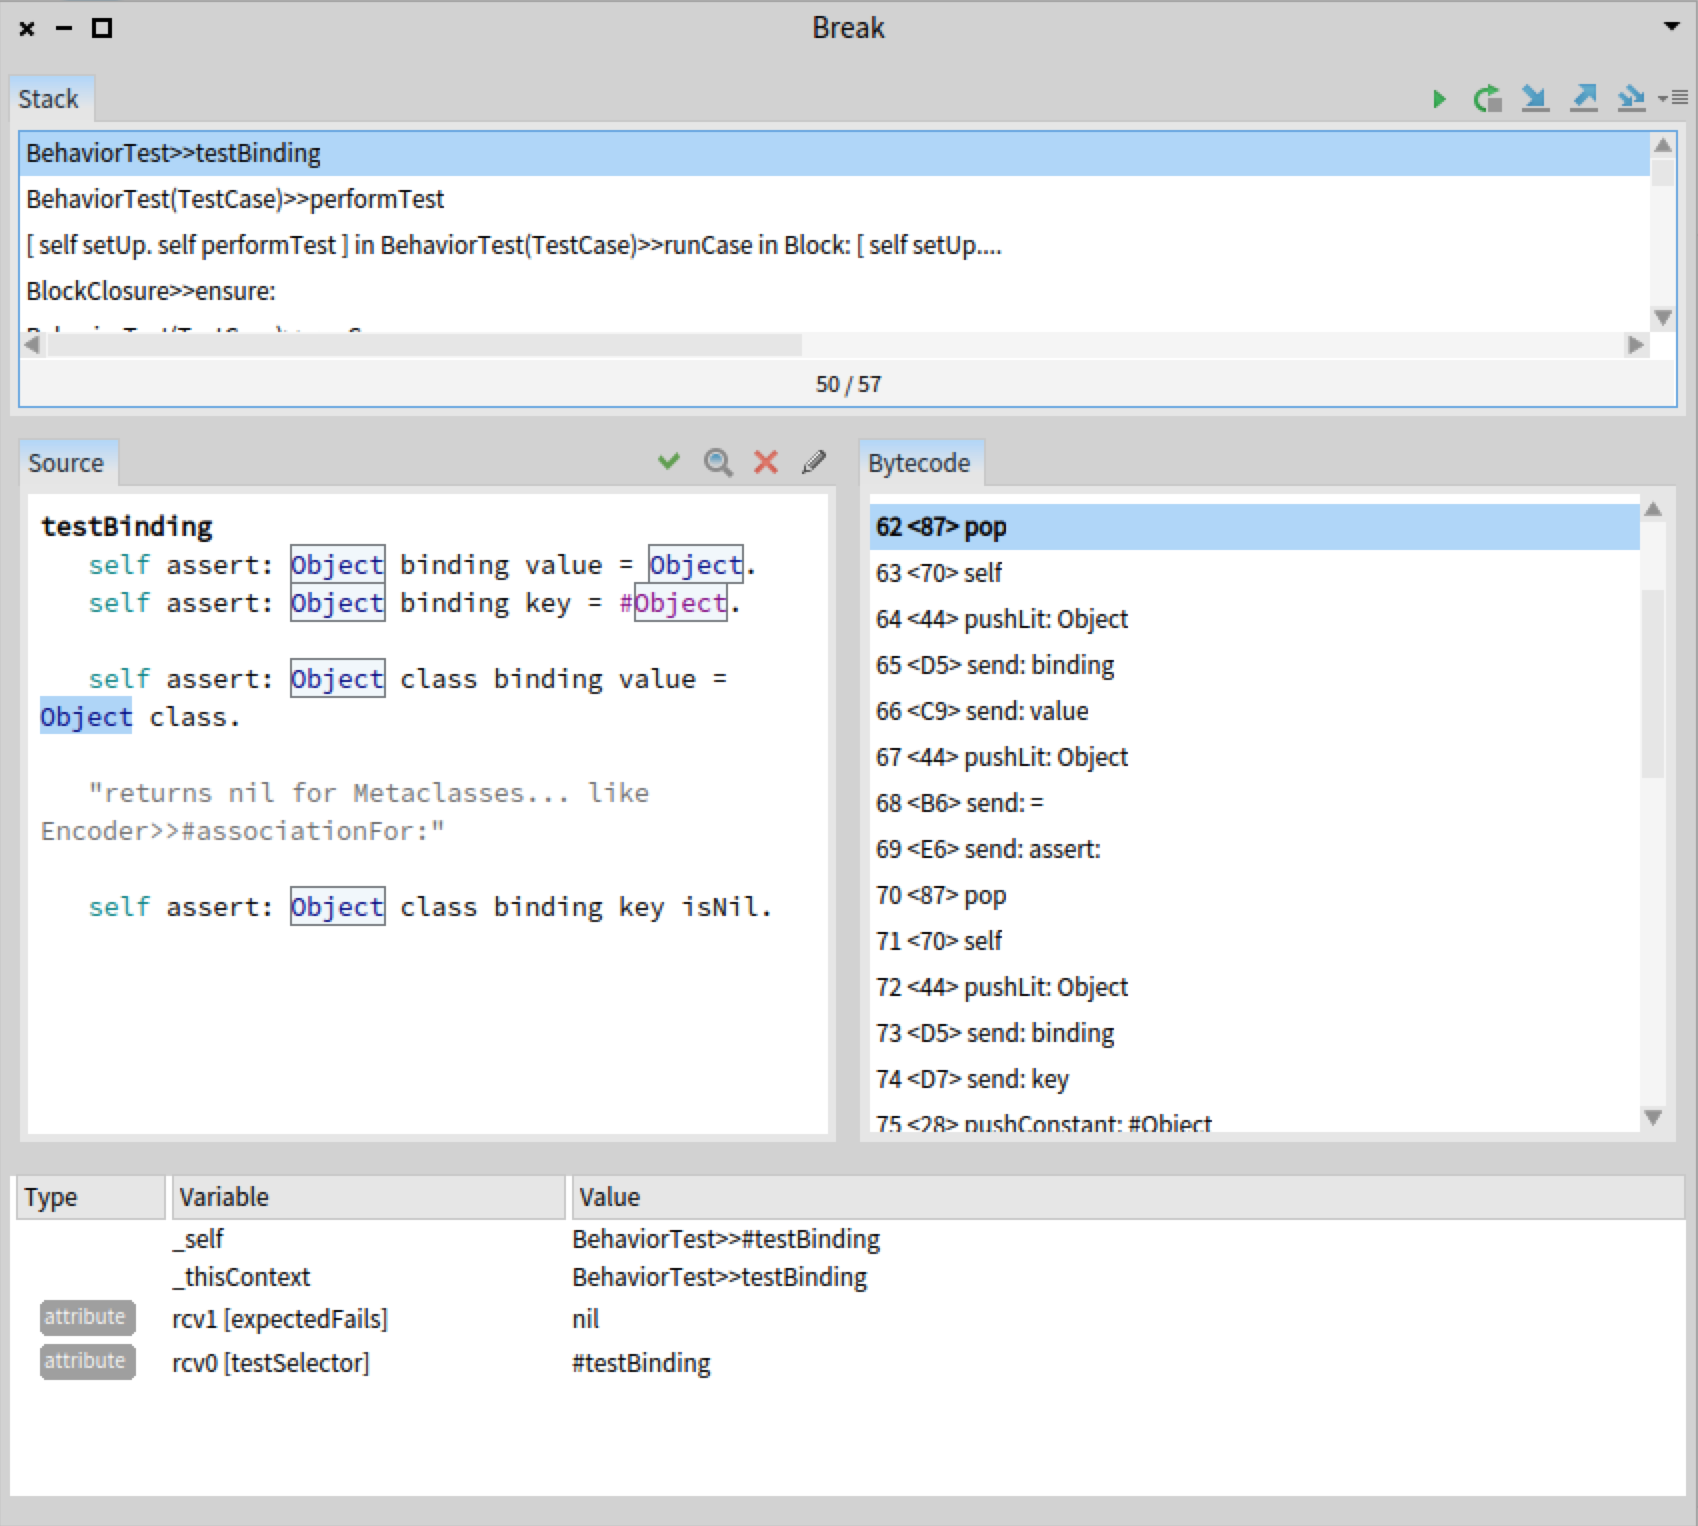
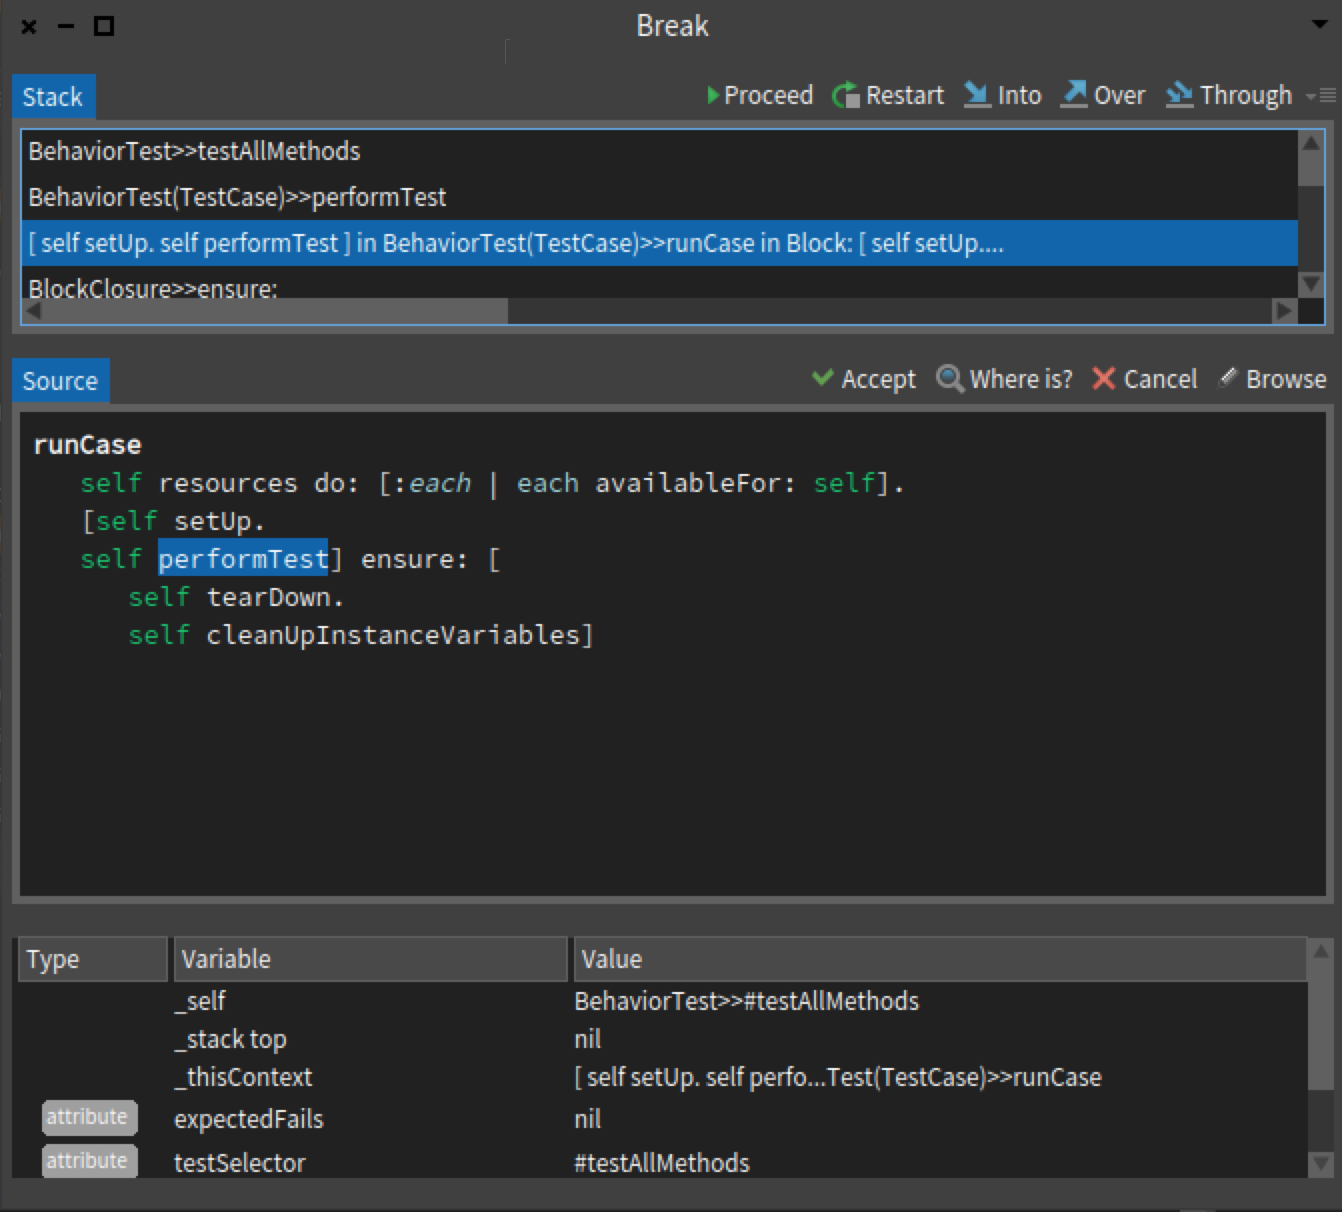
the GTDebugger is a step forward⦠it allow a lot of better interactions and of course, it needs some iterations to make it appealing to everybody. For instance, I took me 2â to tweak the debugger presentation and to get this:
Exactly :) We should also remember that it uses GTInspector which should decrease the cost of maintenance for those parts.
<Screen Shot 2016-01-09 at 09.29.59.png>
(I changed all available⦠is a trivial task)
and like IMO feels a lot better⦠and I think is a good compromise between the old and the new. Reasons to suggest this approach:
- it keeps old approach who(I think) was good (I can see the stack, and the flow feels natural from top to down) - it preserves âthe importantâ (the code) as central. - it gives space for adding columns (like the bytecode).
Yes, we played with this last night and we can adopt it for now.
Now⦠I can understand you want icons with text, and that can be hacked tooâ¦
So⦠can we have an agreement?
Esteban
ps: btw⦠using GT with Fast Table we can also avoid those annoying paginated lists too
Yes. I opened an issue for this: https://pharo.fogbugz.com/f/cases/17362/GTDebugger-should-use-FastTable-to-s... Cheers, Doru
On 09 Jan 2016, at 08:53, stepharo <stepharo@free.fr> wrote:
Thanks for your testimony.
I'm not against GTDebugger per se. I believe that we should have better tools but we should take time for building better tools (even if this is two years that moosers use or not this new debugger). I would appreciate a process where users can give real feedback and we can simplify/shape our tools nicely.
Now for the mooc I will not present GTDebugger. So students will not use Pharo 50
Stef
Le 08/01/2016 21:22, stepharo a écrit :
I'm sorry but this debugger should not be the default one. MONDAY we are filming our mooc and we have to explain the debugger and personally I do not see the gain: - It looks a lot more complex to me and I do not want to have to redo all the screenshots of our lecture. - Just that I have to learn the meaning of small icons. - Why do we need a special pane for the evaluator - Why there is a type column. - Sorry but I'm not convinced about the moldable aspect behind the story (no need to argue I know it)
I would like to avoid to be forced to use not the latest version of Pharo for the mooc.
Such changes are arriving far too late in the release. We do not change the debugger itself the day of code freeze.
We decided that the GTDebugger can be included but to me it never meant that it should be the default one. I think that experts can choose the debugger they want. The newbies don't.
Stef
IMO the old debugger is way more intuitive. When I used the debugger of Eclipse for java I was lost. When I used Spec debugger I thought "Oh, this is not so hard in fact". And I lose the feeling with GTDebugger. And the debugger is one of the main source of interest for newbies.
Maybe we could have a button on the spec Debugger "Switch to GTDebugger"?
-- www.tudorgirba.com www.feenk.com "Don't give to get. Just give."
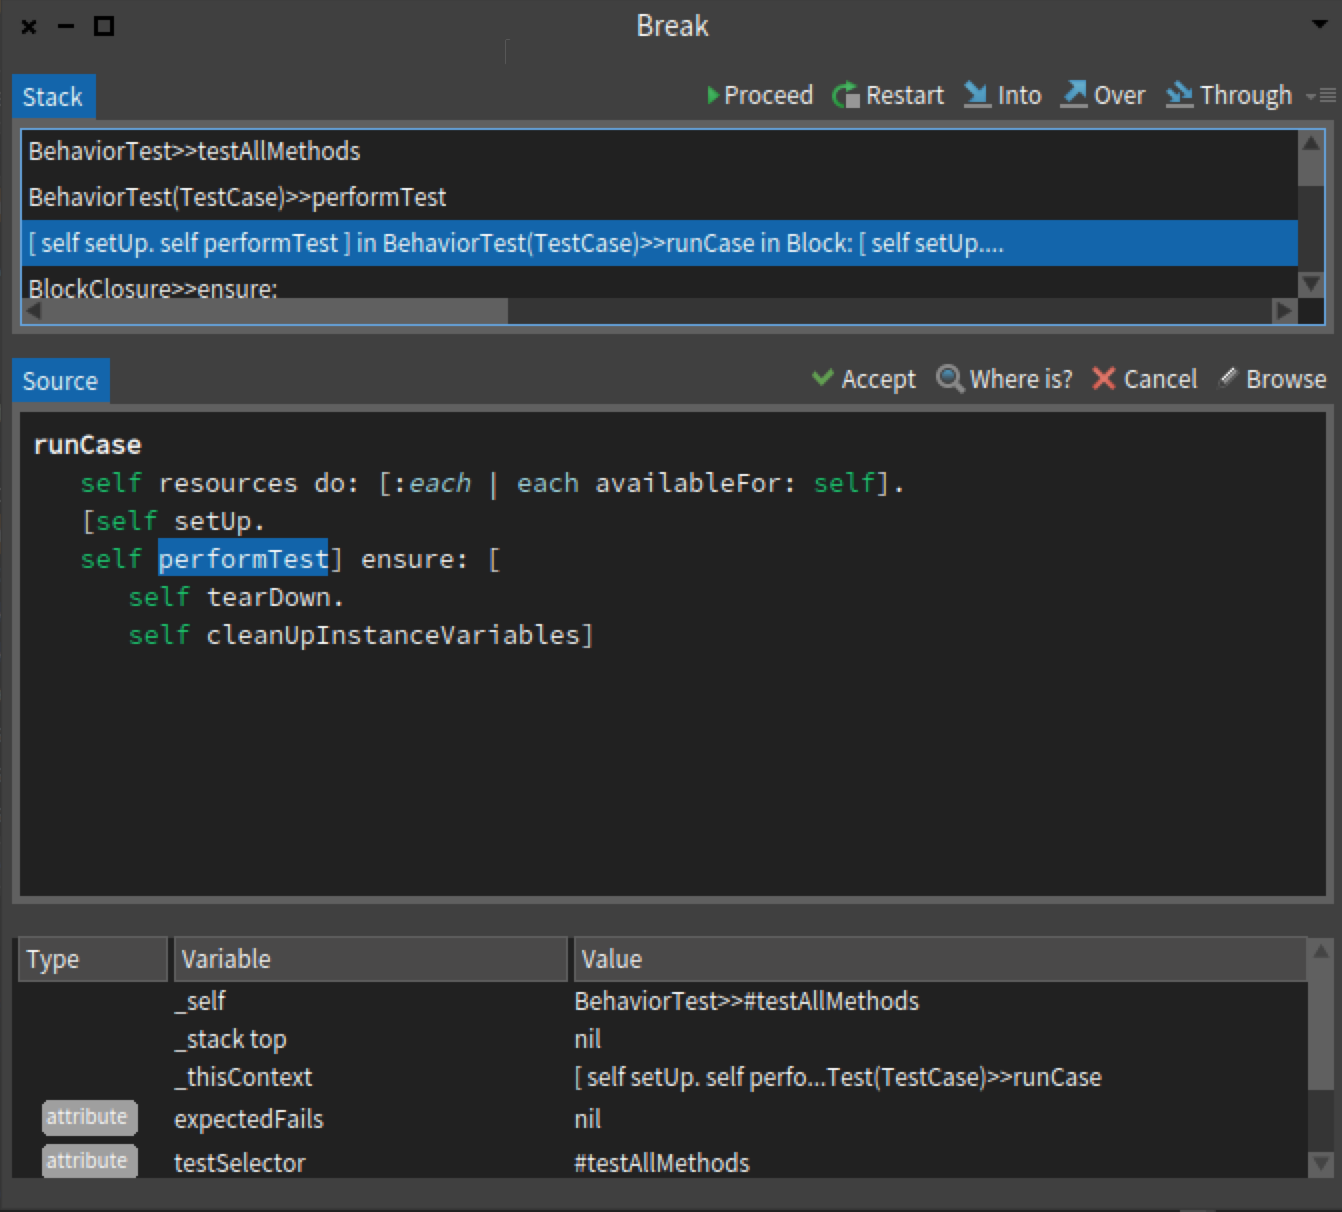
again re-send because of exceed limits with the image (thatâs new?) with a small tweak, texts (AND icons :P): would that be aceptable for you? cheers! Esteban
On 09 Jan 2016, at 09:43, Esteban Lorenzano <estebanlm@gmail.com> wrote:
(re-send because I exceeded limit.)
Hi,
letâs think positive. the GTDebugger is a step forward⦠it allow a lot of better interactions and of course, it needs some iterations to make it appealing to everybody. For instance, I took me 2â to tweak the debugger presentation and to get this:
<Screen Shot 2016-01-09 at 09.29.59.png>
(I changed all available⦠is a trivial task)
and like IMO feels a lot better⦠and I think is a good compromise between the old and the new. Reasons to suggest this approach:
- it keeps old approach who(I think) was good (I can see the stack, and the flow feels natural from top to down) - it preserves âthe importantâ (the code) as central. - it gives space for adding columns (like the bytecode).
Now⦠I can understand you want icons with text, and that can be hacked tooâ¦
So⦠can we have an agreement?
Esteban
ps: btw⦠using GT with Fast Table we can also avoid those annoying paginated lists too
On 09 Jan 2016, at 08:53, stepharo <stepharo@free.fr <mailto:stepharo@free.fr>> wrote:
Thanks for your testimony.
I'm not against GTDebugger per se. I believe that we should have better tools but we should take time for building better tools (even if this is two years that moosers use or not this new debugger). I would appreciate a process where users can give real feedback and we can simplify/shape our tools nicely.
Now for the mooc I will not present GTDebugger. So students will not use Pharo 50
Stef
Le 08/01/2016 21:22, stepharo a écrit :
I'm sorry but this debugger should not be the default one. MONDAY we are filming our mooc and we have to explain the debugger and personally I do not see the gain: - It looks a lot more complex to me and I do not want to have to redo all the screenshots of our lecture. - Just that I have to learn the meaning of small icons. - Why do we need a special pane for the evaluator - Why there is a type column. - Sorry but I'm not convinced about the moldable aspect behind the story (no need to argue I know it)
I would like to avoid to be forced to use not the latest version of Pharo for the mooc.
Such changes are arriving far too late in the release. We do not change the debugger itself the day of code freeze.
We decided that the GTDebugger can be included but to me it never meant that it should be the default one. I think that experts can choose the debugger they want. The newbies don't.
Stef
IMO the old debugger is way more intuitive. When I used the debugger of Eclipse for java I was lost. When I used Spec debugger I thought "Oh, this is not so hard in fact". And I lose the feeling with GTDebugger. And the debugger is one of the main source of interest for newbies.
Maybe we could have a button on the spec Debugger "Switch to GTDebugger"?
you have to confess that with text and icons looks a lot better than the old one :P
On 09 Jan 2016, at 11:01, Esteban Lorenzano <estebanlm@gmail.com> wrote:
again re-send because of exceed limits with the image (thatâs new?)
with a small tweak, texts (AND icons :P):
<Screen Shot 2016-01-09 at 10.59.20.png>
would that be aceptable for you?
cheers! Esteban
On 09 Jan 2016, at 09:43, Esteban Lorenzano <estebanlm@gmail.com <mailto:estebanlm@gmail.com>> wrote:
(re-send because I exceeded limit.)
Hi,
letâs think positive. the GTDebugger is a step forward⦠it allow a lot of better interactions and of course, it needs some iterations to make it appealing to everybody. For instance, I took me 2â to tweak the debugger presentation and to get this:
<Screen Shot 2016-01-09 at 09.29.59.png>
(I changed all available⦠is a trivial task)
and like IMO feels a lot better⦠and I think is a good compromise between the old and the new. Reasons to suggest this approach:
- it keeps old approach who(I think) was good (I can see the stack, and the flow feels natural from top to down) - it preserves âthe importantâ (the code) as central. - it gives space for adding columns (like the bytecode).
Now⦠I can understand you want icons with text, and that can be hacked tooâ¦
So⦠can we have an agreement?
Esteban
ps: btw⦠using GT with Fast Table we can also avoid those annoying paginated lists too
On 09 Jan 2016, at 08:53, stepharo <stepharo@free.fr <mailto:stepharo@free.fr>> wrote:
Thanks for your testimony.
I'm not against GTDebugger per se. I believe that we should have better tools but we should take time for building better tools (even if this is two years that moosers use or not this new debugger). I would appreciate a process where users can give real feedback and we can simplify/shape our tools nicely.
Now for the mooc I will not present GTDebugger. So students will not use Pharo 50
Stef
Le 08/01/2016 21:22, stepharo a écrit :
I'm sorry but this debugger should not be the default one. MONDAY we are filming our mooc and we have to explain the debugger and personally I do not see the gain: - It looks a lot more complex to me and I do not want to have to redo all the screenshots of our lecture. - Just that I have to learn the meaning of small icons. - Why do we need a special pane for the evaluator - Why there is a type column. - Sorry but I'm not convinced about the moldable aspect behind the story (no need to argue I know it)
I would like to avoid to be forced to use not the latest version of Pharo for the mooc.
Such changes are arriving far too late in the release. We do not change the debugger itself the day of code freeze.
We decided that the GTDebugger can be included but to me it never meant that it should be the default one. I think that experts can choose the debugger they want. The newbies don't.
Stef
IMO the old debugger is way more intuitive. When I used the debugger of Eclipse for java I was lost. When I used Spec debugger I thought "Oh, this is not so hard in fact". And I lose the feeling with GTDebugger. And the debugger is one of the main source of interest for newbies.
Maybe we could have a button on the spec Debugger "Switch to GTDebugger"?
Hi, Thanks! Could you publish the code and then we can iterate over it? Cheers, Doru
On Jan 9, 2016, at 12:02 PM, Esteban Lorenzano <estebanlm@gmail.com> wrote:
you have to confess that with text and icons looks a lot better than the old one :P
On 09 Jan 2016, at 11:01, Esteban Lorenzano <estebanlm@gmail.com> wrote:
again re-send because of exceed limits with the image (thatâs new?)
with a small tweak, texts (AND icons :P):
<Screen Shot 2016-01-09 at 10.59.20.png>
would that be aceptable for you?
cheers! Esteban
On 09 Jan 2016, at 09:43, Esteban Lorenzano <estebanlm@gmail.com> wrote:
(re-send because I exceeded limit.)
Hi,
letâs think positive. the GTDebugger is a step forward⦠it allow a lot of better interactions and of course, it needs some iterations to make it appealing to everybody. For instance, I took me 2â to tweak the debugger presentation and to get this:
<Screen Shot 2016-01-09 at 09.29.59.png>
(I changed all available⦠is a trivial task)
and like IMO feels a lot better⦠and I think is a good compromise between the old and the new. Reasons to suggest this approach:
- it keeps old approach who(I think) was good (I can see the stack, and the flow feels natural from top to down) - it preserves âthe importantâ (the code) as central. - it gives space for adding columns (like the bytecode).
Now⦠I can understand you want icons with text, and that can be hacked tooâ¦
So⦠can we have an agreement?
Esteban
ps: btw⦠using GT with Fast Table we can also avoid those annoying paginated lists too
On 09 Jan 2016, at 08:53, stepharo <stepharo@free.fr> wrote:
Thanks for your testimony.
I'm not against GTDebugger per se. I believe that we should have better tools but we should take time for building better tools (even if this is two years that moosers use or not this new debugger). I would appreciate a process where users can give real feedback and we can simplify/shape our tools nicely.
Now for the mooc I will not present GTDebugger. So students will not use Pharo 50
Stef
Le 08/01/2016 21:22, stepharo a écrit :
I'm sorry but this debugger should not be the default one. MONDAY we are filming our mooc and we have to explain the debugger and personally I do not see the gain: - It looks a lot more complex to me and I do not want to have to redo all the screenshots of our lecture. - Just that I have to learn the meaning of small icons. - Why do we need a special pane for the evaluator - Why there is a type column. - Sorry but I'm not convinced about the moldable aspect behind the story (no need to argue I know it)
I would like to avoid to be forced to use not the latest version of Pharo for the mooc.
Such changes are arriving far too late in the release. We do not change the debugger itself the day of code freeze.
We decided that the GTDebugger can be included but to me it never meant that it should be the default one. I think that experts can choose the debugger they want. The newbies don't.
Stef
IMO the old debugger is way more intuitive. When I used the debugger of Eclipse for java I was lost. When I used Spec debugger I thought "Oh, this is not so hard in fact". And I lose the feeling with GTDebugger. And the debugger is one of the main source of interest for newbies.
Maybe we could have a button on the spec Debugger "Switch to GTDebugger"?
-- www.tudorgirba.com www.feenk.com "Speaking louder won't make the point worthier."
Am 09.01.2016 11:03 vorm. schrieb "Esteban Lorenzano" <estebanlm@gmail.com>:
you have to confess that with text and icons looks a lot better than the
old one :P
Yes alot better
On 09 Jan 2016, at 11:01, Esteban Lorenzano <estebanlm@gmail.com> wrote:
again re-send because of exceed limits with the image (thatâs new?)
with a small tweak, texts (AND icons :P):
<Screen Shot 2016-01-09 at 10.59.20.png>
would that be aceptable for you?
cheers! Esteban
On 09 Jan 2016, at 09:43, Esteban Lorenzano <estebanlm@gmail.com> wrote:
(re-send because I exceeded limit.)
Hi,
letâs think positive. the GTDebugger is a step forward⦠it allow a lot of better interactions and of course, it needs some iterations to make it appealing to everybody. For instance, I took me 2â to tweak the debugger presentation and to get this:
<Screen Shot 2016-01-09 at 09.29.59.png>
(I changed all available⦠is a trivial task)
and like IMO feels a lot better⦠and I think is a good compromise between the old and the new. Reasons to suggest this approach:
- it keeps old approach who(I think) was good (I can see the stack, and the flow feels natural from top to down) - it preserves âthe importantâ (the code) as central. - it gives space for adding columns (like the bytecode).
Now⦠I can understand you want icons with text, and that can be hacked tooâ¦
So⦠can we have an agreement?
Esteban
ps: btw⦠using GT with Fast Table we can also avoid those annoying paginated lists too
On 09 Jan 2016, at 08:53, stepharo <stepharo@free.fr> wrote:
Thanks for your testimony.
I'm not against GTDebugger per se. I believe that we should have better tools but we should take time for building better tools (even if this is two years that moosers use or not this new debugger). I would appreciate a process where users can give real feedback and we can simplify/shape our tools nicely.
Now for the mooc I will not present GTDebugger. So students will not use Pharo 50
Stef
Le 08/01/2016 21:22, stepharo a écrit :
I'm sorry but this debugger should not be the default one. MONDAY we are filming our mooc and we have to explain the debugger
and
personally I do not see the gain: - It looks a lot more complex to me and I do not want to have to redo all the screenshots of our lecture. - Just that I have to learn the meaning of small icons. - Why do we need a special pane for the evaluator - Why there is a type column. - Sorry but I'm not convinced about the moldable aspect behind the story (no need to argue I know it)
I would like to avoid to be forced to use not the latest version of Pharo for the mooc.
Such changes are arriving far too late in the release. We do not change the debugger itself the day of code freeze.
We decided that the GTDebugger can be included but to me it never meant that it should be the default one. I think that experts can choose the debugger they want. The newbies don't.
Stef
IMO the old debugger is way more intuitive. When I used the debugger of Eclipse for java I was lost. When I used Spec debugger I thought "Oh, this is not so hard in fact". And I lose the feeling with GTDebugger. And the debugger is one of the main source of interest for newbies.
Maybe we could have a button on the spec Debugger "Switch to GTDebugger"?
Le 9/1/16 11:02, Esteban Lorenzano a écrit :
you have to confess that with text and icons looks a lot better than the old one :P
you mean both old ones GT and Spec. I hated the the GT icons because I was forced to wait for the fly by help I hate this interfaces that looks nice but are not efficient.
On 09 Jan 2016, at 11:01, Esteban Lorenzano <estebanlm@gmail.com <mailto:estebanlm@gmail.com>> wrote:
again re-send because of exceed limits with the image (thatâs new?)
with a small tweak, texts (AND icons :P):
<Screen Shot 2016-01-09 at 10.59.20.png>
would that be aceptable for you?
cheers! Esteban
On 09 Jan 2016, at 09:43, Esteban Lorenzano <estebanlm@gmail.com <mailto:estebanlm@gmail.com>> wrote:
(re-send because I exceeded limit.)
Hi,
letâs think positive. the GTDebugger is a step forward⦠it allow a lot of better interactions and of course, it needs some iterations to make it appealing to everybody. For instance, I took me 2â to tweak the debugger presentation and to get this:
<Screen Shot 2016-01-09 at 09.29.59.png>
(I changed all available⦠is a trivial task)
and like IMO feels a lot better⦠and I think is a good compromise between the old and the new. Reasons to suggest this approach:
- it keeps old approach who(I think) was good (I can see the stack, and the flow feels natural from top to down) - it preserves âthe importantâ (the code) as central. - it gives space for adding columns (like the bytecode).
Now⦠I can understand you want icons with text, and that can be hacked tooâ¦
So⦠can we have an agreement?
Esteban
ps: btw⦠using GT with Fast Table we can also avoid those annoying paginated lists too
On 09 Jan 2016, at 08:53, stepharo <stepharo@free.fr <mailto:stepharo@free.fr>> wrote:
Thanks for your testimony.
I'm not against GTDebugger per se. I believe that we should have better tools but we should take time for building better tools (even if this is two years that moosers use or not this new debugger). I would appreciate a process where users can give real feedback and we can simplify/shape our tools nicely.
Now for the mooc I will not present GTDebugger. So students will not use Pharo 50
Stef
Le 08/01/2016 21:22, stepharo a écrit :
I'm sorry but this debugger should not be the default one. MONDAY we are filming our mooc and we have to explain the debugger and personally I do not see the gain: - It looks a lot more complex to me and I do not want to have to redo all the screenshots of our lecture. - Just that I have to learn the meaning of small icons. - Why do we need a special pane for the evaluator - Why there is a type column. - Sorry but I'm not convinced about the moldable aspect behind the story (no need to argue I know it)
I would like to avoid to be forced to use not the latest version of Pharo for the mooc.
Such changes are arriving far too late in the release. We do not change the debugger itself the day of code freeze.
We decided that the GTDebugger can be included but to me it never meant that it should be the default one. I think that experts can choose the debugger they want. The newbies don't.
Stef
IMO the old debugger is way more intuitive. When I used the debugger of Eclipse for java I was lost. When I used Spec debugger I thought "Oh, this is not so hard in fact". And I lose the feeling with GTDebugger. And the debugger is one of the main source of interest for newbies.
Maybe we could have a button on the spec Debugger "Switch to GTDebugger"?
looks lovely Is there a way to add the new debugger to my existing image ? How I get the new debugger, I downloaded the latest image and is not in it, On Sat, Jan 9, 2016 at 12:02 PM Esteban Lorenzano <estebanlm@gmail.com> wrote:
again re-send because of exceed limits with the image (thatâs new?)
with a small tweak, texts (AND icons :P):
[image: Screen Shot 2016-01-09 at 10.59.20.png]
would that be aceptable for you?
cheers! Esteban
On 09 Jan 2016, at 09:43, Esteban Lorenzano <estebanlm@gmail.com> wrote:
(re-send because I exceeded limit.)
Hi,
letâs think positive. the GTDebugger is a step forward⦠it allow a lot of better interactions and of course, it needs some iterations to make it appealing to everybody. For instance, I took me 2â to tweak the debugger presentation and to get this:
<Screen Shot 2016-01-09 at 09.29.59.png>
(I changed all available⦠is a trivial task)
and like IMO feels a lot better⦠and I think is a good compromise between the old and the new. Reasons to suggest this approach:
- it keeps old approach who(I think) was good (I can see the stack, and the flow feels natural from top to down) - it preserves âthe importantâ (the code) as central. - it gives space for adding columns (like the bytecode).
Now⦠I can understand you want icons with text, and that can be hacked tooâ¦
So⦠can we have an agreement?
Esteban
ps: btw⦠using GT with Fast Table we can also avoid those annoying paginated lists too
On 09 Jan 2016, at 08:53, stepharo <stepharo@free.fr> wrote:
Thanks for your testimony.
I'm not against GTDebugger per se. I believe that we should have better tools but we should take time for building better tools (even if this is two years that moosers use or not this new debugger). I would appreciate a process where users can give real feedback and we can simplify/shape our tools nicely.
Now for the mooc I will not present GTDebugger. So students will not use Pharo 50
Stef
Le 08/01/2016 21:22, stepharo a écrit :
I'm sorry but this debugger should not be the default one. MONDAY we are filming our mooc and we have to explain the debugger and personally I do not see the gain: - It looks a lot more complex to me and I do not want to have to redo all the screenshots of our lecture. - Just that I have to learn the meaning of small icons. - Why do we need a special pane for the evaluator - Why there is a type column. - Sorry but I'm not convinced about the moldable aspect behind the story (no need to argue I know it)
I would like to avoid to be forced to use not the latest version of Pharo for the mooc.
Such changes are arriving far too late in the release. We do not change the debugger itself the day of code freeze.
We decided that the GTDebugger can be included but to me it never meant that it should be the default one. I think that experts can choose the debugger they want. The newbies don't.
Stef
IMO the old debugger is way more intuitive. When I used the debugger of Eclipse for java I was lost. When I used Spec debugger I thought "Oh, this is not so hard in fact". And I lose the feeling with GTDebugger. And the debugger is one of the main source of interest for newbies.
Maybe we could have a button on the spec Debugger "Switch to GTDebugger"?
You get it in the Moose image until it gets integrated :). Doru
On Jan 9, 2016, at 12:11 PM, Dimitris Chloupis <kilon.alios@gmail.com> wrote:
looks lovely
Is there a way to add the new debugger to my existing image ? How I get the new debugger, I downloaded the latest image and is not in it,
On Sat, Jan 9, 2016 at 12:02 PM Esteban Lorenzano <estebanlm@gmail.com> wrote: again re-send because of exceed limits with the image (thatâs new?)
with a small tweak, texts (AND icons :P):
<Screen Shot 2016-01-09 at 10.59.20.png>
would that be aceptable for you?
cheers! Esteban
On 09 Jan 2016, at 09:43, Esteban Lorenzano <estebanlm@gmail.com> wrote:
(re-send because I exceeded limit.)
Hi,
letâs think positive. the GTDebugger is a step forward⦠it allow a lot of better interactions and of course, it needs some iterations to make it appealing to everybody. For instance, I took me 2â to tweak the debugger presentation and to get this:
<Screen Shot 2016-01-09 at 09.29.59.png>
(I changed all available⦠is a trivial task)
and like IMO feels a lot better⦠and I think is a good compromise between the old and the new. Reasons to suggest this approach:
- it keeps old approach who(I think) was good (I can see the stack, and the flow feels natural from top to down) - it preserves âthe importantâ (the code) as central. - it gives space for adding columns (like the bytecode).
Now⦠I can understand you want icons with text, and that can be hacked tooâ¦
So⦠can we have an agreement?
Esteban
ps: btw⦠using GT with Fast Table we can also avoid those annoying paginated lists too
On 09 Jan 2016, at 08:53, stepharo <stepharo@free.fr> wrote:
Thanks for your testimony.
I'm not against GTDebugger per se. I believe that we should have better tools but we should take time for building better tools (even if this is two years that moosers use or not this new debugger). I would appreciate a process where users can give real feedback and we can simplify/shape our tools nicely.
Now for the mooc I will not present GTDebugger. So students will not use Pharo 50
Stef
Le 08/01/2016 21:22, stepharo a écrit :
I'm sorry but this debugger should not be the default one. MONDAY we are filming our mooc and we have to explain the debugger and personally I do not see the gain: - It looks a lot more complex to me and I do not want to have to redo all the screenshots of our lecture. - Just that I have to learn the meaning of small icons. - Why do we need a special pane for the evaluator - Why there is a type column. - Sorry but I'm not convinced about the moldable aspect behind the story (no need to argue I know it)
I would like to avoid to be forced to use not the latest version of Pharo for the mooc.
Such changes are arriving far too late in the release. We do not change the debugger itself the day of code freeze.
We decided that the GTDebugger can be included but to me it never meant that it should be the default one. I think that experts can choose the debugger they want. The newbies don't.
Stef
IMO the old debugger is way more intuitive. When I used the debugger of Eclipse for java I was lost. When I used Spec debugger I thought "Oh, this is not so hard in fact". And I lose the feeling with GTDebugger. And the debugger is one of the main source of interest for newbies.
Maybe we could have a button on the spec Debugger "Switch to GTDebugger"?
-- www.tudorgirba.com www.feenk.com "In a world where everything is moving ever faster, one might have better chances to win by moving slower."
any idea when that will happen ? On Sat, Jan 9, 2016 at 12:19 PM Tudor Girba <tudor@tudorgirba.com> wrote:
You get it in the Moose image until it gets integrated :).
Doru
On Jan 9, 2016, at 12:11 PM, Dimitris Chloupis <kilon.alios@gmail.com> wrote:
looks lovely
Is there a way to add the new debugger to my existing image ? How I get the new debugger, I downloaded the latest image and is not in it,
On Sat, Jan 9, 2016 at 12:02 PM Esteban Lorenzano <estebanlm@gmail.com> wrote: again re-send because of exceed limits with the image (thatâs new?)
with a small tweak, texts (AND icons :P):
<Screen Shot 2016-01-09 at 10.59.20.png>
would that be aceptable for you?
cheers! Esteban
On 09 Jan 2016, at 09:43, Esteban Lorenzano <estebanlm@gmail.com> wrote:
(re-send because I exceeded limit.)
Hi,
letâs think positive. the GTDebugger is a step forward⦠it allow a lot of better interactions and of course, it needs some iterations to make it appealing to everybody. For instance, I took me 2â to tweak the debugger presentation and to get this:
<Screen Shot 2016-01-09 at 09.29.59.png>
(I changed all available⦠is a trivial task)
and like IMO feels a lot better⦠and I think is a good compromise between the old and the new. Reasons to suggest this approach:
- it keeps old approach who(I think) was good (I can see the stack, and the flow feels natural from top to down) - it preserves âthe importantâ (the code) as central. - it gives space for adding columns (like the bytecode).
Now⦠I can understand you want icons with text, and that can be hacked tooâ¦
So⦠can we have an agreement?
Esteban
ps: btw⦠using GT with Fast Table we can also avoid those annoying paginated lists too
On 09 Jan 2016, at 08:53, stepharo <stepharo@free.fr> wrote:
Thanks for your testimony.
I'm not against GTDebugger per se. I believe that we should have better tools but we should take time for building better tools (even if this is two years that moosers use or not this new debugger). I would appreciate a process where users can give real feedback and we can simplify/shape our tools nicely.
Now for the mooc I will not present GTDebugger. So students will not use Pharo 50
Stef
Le 08/01/2016 21:22, stepharo a écrit :
I'm sorry but this debugger should not be the default one. MONDAY we are filming our mooc and we have to explain the debugger and personally I do not see the gain: - It looks a lot more complex to me and I do not want to have to redo all the screenshots of our lecture. - Just that I have to learn the meaning of small icons. - Why do we need a special pane for the evaluator - Why there is a type column. - Sorry but I'm not convinced about the moldable aspect behind the story (no need to argue I know it)
I would like to avoid to be forced to use not the latest version of Pharo for the mooc.
Such changes are arriving far too late in the release. We do not change the debugger itself the day of code freeze.
We decided that the GTDebugger can be included but to me it never meant that it should be the default one. I think that experts can choose the debugger they want. The newbies don't.
Stef
IMO the old debugger is way more intuitive. When I used the debugger of Eclipse for java I was lost. When I used Spec debugger I thought "Oh, this is not so hard in fact". And I lose the feeling with GTDebugger. And the debugger is one of the main source of interest for newbies.
Maybe we could have a button on the spec Debugger "Switch to GTDebugger"?
-- www.tudorgirba.com www.feenk.com
"In a world where everything is moving ever faster, one might have better chances to win by moving slower."
Very nice (also because of the Dark theme ;-)
On 09 Jan 2016, at 11:01, Esteban Lorenzano <estebanlm@gmail.com> wrote:
again re-send because of exceed limits with the image (thatâs new?)
with a small tweak, texts (AND icons :P):
<Screen Shot 2016-01-09 at 10.59.20.png>
would that be aceptable for you?
cheers! Esteban
On 09 Jan 2016, at 09:43, Esteban Lorenzano <estebanlm@gmail.com> wrote:
(re-send because I exceeded limit.)
Hi,
letâs think positive. the GTDebugger is a step forward⦠it allow a lot of better interactions and of course, it needs some iterations to make it appealing to everybody. For instance, I took me 2â to tweak the debugger presentation and to get this:
<Screen Shot 2016-01-09 at 09.29.59.png>
(I changed all available⦠is a trivial task)
and like IMO feels a lot better⦠and I think is a good compromise between the old and the new. Reasons to suggest this approach:
- it keeps old approach who(I think) was good (I can see the stack, and the flow feels natural from top to down) - it preserves âthe importantâ (the code) as central. - it gives space for adding columns (like the bytecode).
Now⦠I can understand you want icons with text, and that can be hacked tooâ¦
So⦠can we have an agreement?
Esteban
ps: btw⦠using GT with Fast Table we can also avoid those annoying paginated lists too
On 09 Jan 2016, at 08:53, stepharo <stepharo@free.fr> wrote:
Thanks for your testimony.
I'm not against GTDebugger per se. I believe that we should have better tools but we should take time for building better tools (even if this is two years that moosers use or not this new debugger). I would appreciate a process where users can give real feedback and we can simplify/shape our tools nicely.
Now for the mooc I will not present GTDebugger. So students will not use Pharo 50
Stef
Le 08/01/2016 21:22, stepharo a écrit :
I'm sorry but this debugger should not be the default one. MONDAY we are filming our mooc and we have to explain the debugger and personally I do not see the gain: - It looks a lot more complex to me and I do not want to have to redo all the screenshots of our lecture. - Just that I have to learn the meaning of small icons. - Why do we need a special pane for the evaluator - Why there is a type column. - Sorry but I'm not convinced about the moldable aspect behind the story (no need to argue I know it)
I would like to avoid to be forced to use not the latest version of Pharo for the mooc.
Such changes are arriving far too late in the release. We do not change the debugger itself the day of code freeze.
We decided that the GTDebugger can be included but to me it never meant that it should be the default one. I think that experts can choose the debugger they want. The newbies don't.
Stef
IMO the old debugger is way more intuitive. When I used the debugger of Eclipse for java I was lost. When I used Spec debugger I thought "Oh, this is not so hard in fact". And I lose the feeling with GTDebugger. And the debugger is one of the main source of interest for newbies.
Maybe we could have a button on the spec Debugger "Switch to GTDebugger"?
Le 9/1/16 11:01, Esteban Lorenzano a écrit :
again re-send because of exceed limits with the image (thatâs new?)
with a small tweak, texts (AND icons :P):
And text. I asked that during two years in GT but I was told it was not possible. Like that I do not have to learn these icons What is the Where is?
would that be aceptable for you?
cheers! Esteban
On 09 Jan 2016, at 09:43, Esteban Lorenzano <estebanlm@gmail.com <mailto:estebanlm@gmail.com>> wrote:
(re-send because I exceeded limit.)
Hi,
letâs think positive. the GTDebugger is a step forward⦠it allow a lot of better interactions and of course, it needs some iterations to make it appealing to everybody. For instance, I took me 2â to tweak the debugger presentation and to get this:
<Screen Shot 2016-01-09 at 09.29.59.png>
(I changed all available⦠is a trivial task)
and like IMO feels a lot better⦠and I think is a good compromise between the old and the new. Reasons to suggest this approach:
- it keeps old approach who(I think) was good (I can see the stack, and the flow feels natural from top to down) - it preserves âthe importantâ (the code) as central. - it gives space for adding columns (like the bytecode).
Now⦠I can understand you want icons with text, and that can be hacked tooâ¦
So⦠can we have an agreement?
Esteban
ps: btw⦠using GT with Fast Table we can also avoid those annoying paginated lists too
On 09 Jan 2016, at 08:53, stepharo <stepharo@free.fr <mailto:stepharo@free.fr>> wrote:
Thanks for your testimony.
I'm not against GTDebugger per se. I believe that we should have better tools but we should take time for building better tools (even if this is two years that moosers use or not this new debugger). I would appreciate a process where users can give real feedback and we can simplify/shape our tools nicely.
Now for the mooc I will not present GTDebugger. So students will not use Pharo 50
Stef
Le 08/01/2016 21:22, stepharo a écrit :
I'm sorry but this debugger should not be the default one. MONDAY we are filming our mooc and we have to explain the debugger and personally I do not see the gain: - It looks a lot more complex to me and I do not want to have to redo all the screenshots of our lecture. - Just that I have to learn the meaning of small icons. - Why do we need a special pane for the evaluator - Why there is a type column. - Sorry but I'm not convinced about the moldable aspect behind the story (no need to argue I know it)
I would like to avoid to be forced to use not the latest version of Pharo for the mooc.
Such changes are arriving far too late in the release. We do not change the debugger itself the day of code freeze.
We decided that the GTDebugger can be included but to me it never meant that it should be the default one. I think that experts can choose the debugger they want. The newbies don't.
Stef
IMO the old debugger is way more intuitive. When I used the debugger of Eclipse for java I was lost. When I used Spec debugger I thought "Oh, this is not so hard in fact". And I lose the feeling with GTDebugger. And the debugger is one of the main source of interest for newbies.
Maybe we could have a button on the spec Debugger "Switch to GTDebugger"?
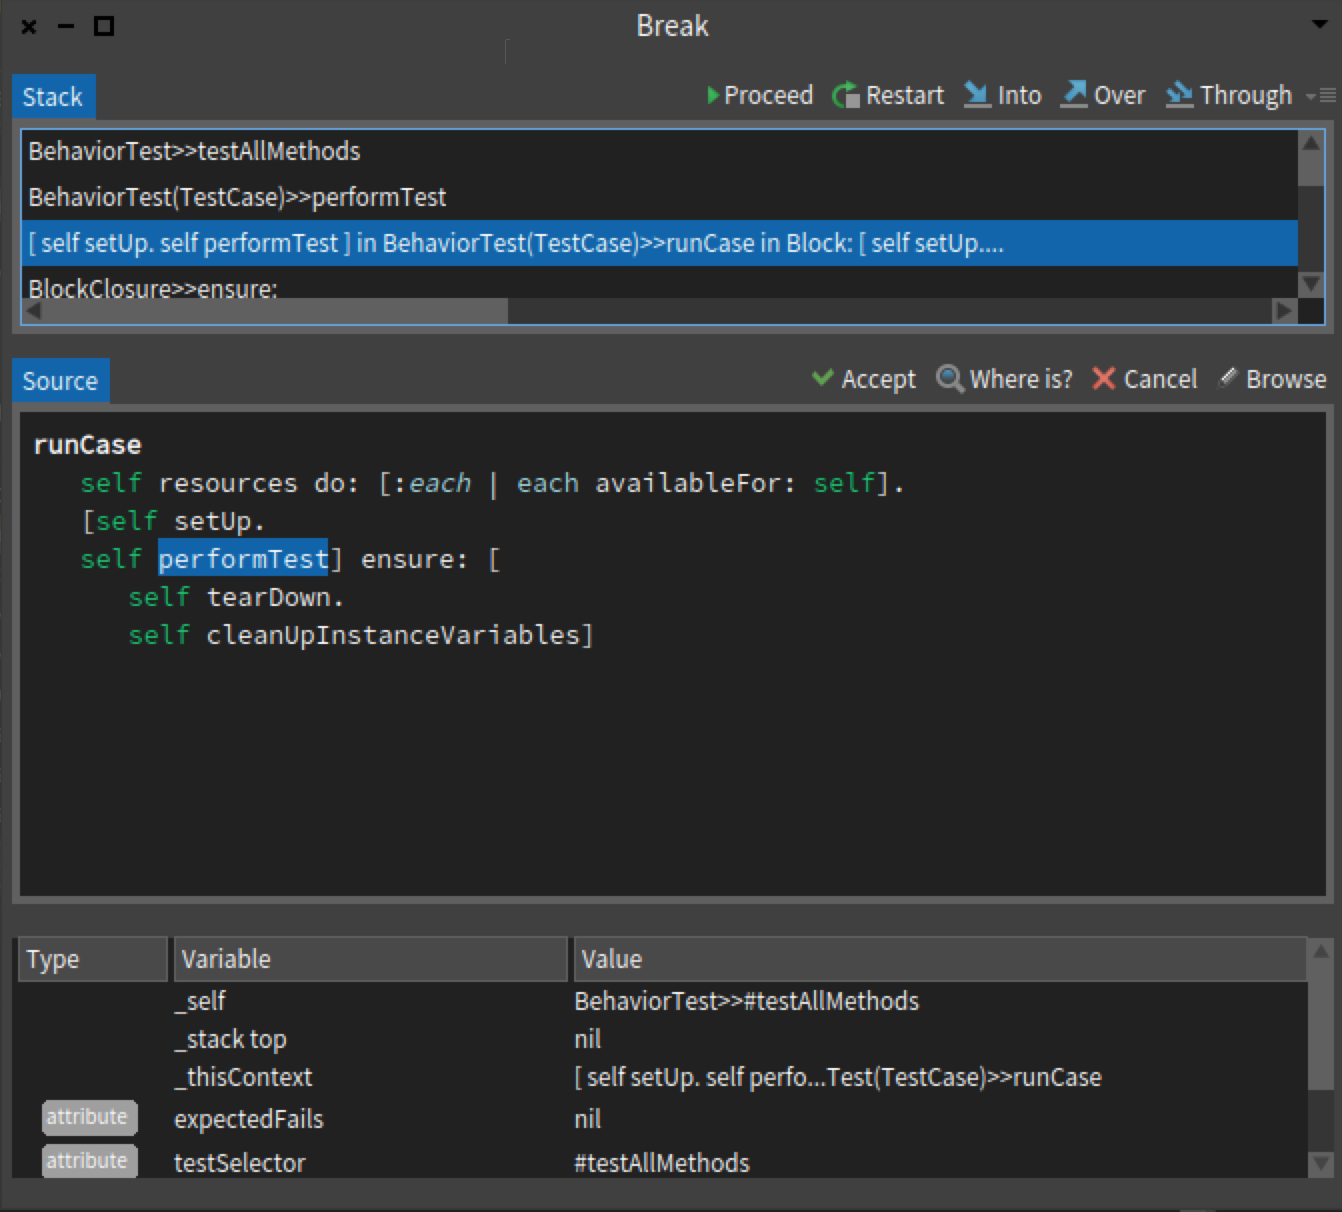
Which brings us to my question, where did tooltips go ? Squeak had them and then they were gone in pharo. Personally I dont see the point of having an icon to have text next to it. Seriously how much time it takes you to learn what each icon does ? and the debugger is not exactly a tool you will be using once per month, so the chance of forgeting gets pretty low after the first week. So my vote goes to get rid of text, it wastes valuable gui space in an environment where windows fight for space. And even on my 27'' monitor I rather have as compact as possible GUI. On Sat, Jan 9, 2016 at 3:05 PM stepharo <stepharo@free.fr> wrote:
Le 9/1/16 11:01, Esteban Lorenzano a écrit :
again re-send because of exceed limits with the image (thatâs new?)
with a small tweak, texts (AND icons :P):
And text. I asked that during two years in GT but I was told it was not possible. Like that I do not have to learn these icons What is the Where is?
would that be aceptable for you?
cheers! Esteban
On 09 Jan 2016, at 09:43, Esteban Lorenzano <estebanlm@gmail.com> wrote:
(re-send because I exceeded limit.)
Hi,
letâs think positive. the GTDebugger is a step forward⦠it allow a lot of better interactions and of course, it needs some iterations to make it appealing to everybody. For instance, I took me 2â to tweak the debugger presentation and to get this:
<Screen Shot 2016-01-09 at 09.29.59.png>
(I changed all available⦠is a trivial task)
and like IMO feels a lot better⦠and I think is a good compromise between the old and the new. Reasons to suggest this approach:
- it keeps old approach who(I think) was good (I can see the stack, and the flow feels natural from top to down) - it preserves âthe importantâ (the code) as central. - it gives space for adding columns (like the bytecode).
Now⦠I can understand you want icons with text, and that can be hacked tooâ¦
So⦠can we have an agreement?
Esteban
ps: btw⦠using GT with Fast Table we can also avoid those annoying paginated lists too
On 09 Jan 2016, at 08:53, stepharo <stepharo@free.fr> wrote:
Thanks for your testimony.
I'm not against GTDebugger per se. I believe that we should have better tools but we should take time for building better tools (even if this is two years that moosers use or not this new debugger). I would appreciate a process where users can give real feedback and we can simplify/shape our tools nicely.
Now for the mooc I will not present GTDebugger. So students will not use Pharo 50
Stef
Le 08/01/2016 21:22, stepharo a écrit :
I'm sorry but this debugger should not be the default one. MONDAY we are filming our mooc and we have to explain the debugger and personally I do not see the gain: - It looks a lot more complex to me and I do not want to have to redo all the screenshots of our lecture. - Just that I have to learn the meaning of small icons. - Why do we need a special pane for the evaluator - Why there is a type column. - Sorry but I'm not convinced about the moldable aspect behind the story (no need to argue I know it)
I would like to avoid to be forced to use not the latest version of Pharo for the mooc.
Such changes are arriving far too late in the release. We do not change the debugger itself the day of code freeze.
We decided that the GTDebugger can be included but to me it never meant that it should be the default one. I think that experts can choose the debugger they want. The newbies don't.
Stef
IMO the old debugger is way more intuitive. When I used the debugger of Eclipse for java I was lost. When I used Spec debugger I thought "Oh, this is not so hard in fact". And I lose the feeling with GTDebugger. And the debugger is one of the main source of interest for newbies.
Maybe we could have a button on the spec Debugger "Switch to GTDebugger"?
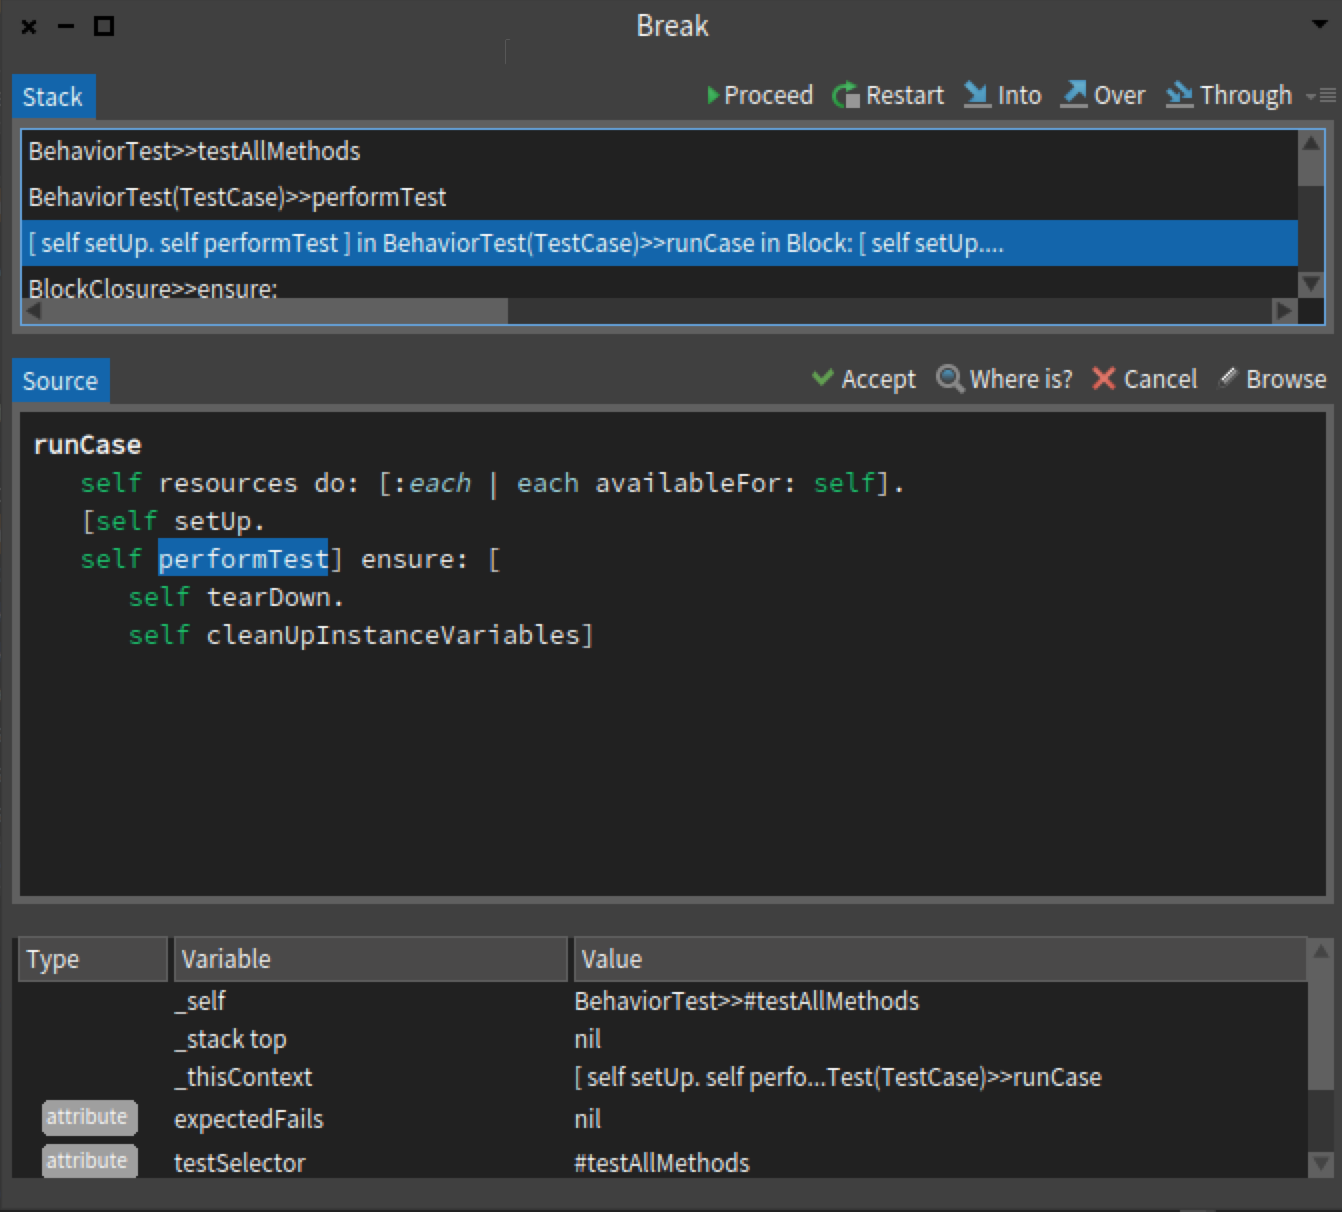

Hi, It is impossible to satisfy everyone. What I would suggest is to have text + icons as default and a preference to only have icons. Christophe Le 9 janv. 2016 à 14:30, Dimitris Chloupis a écrit :
Which brings us to my question, where did tooltips go ? Squeak had them and then they were gone in pharo.
Personally I dont see the point of having an icon to have text next to it. Seriously how much time it takes you to learn what each icon does ?
and the debugger is not exactly a tool you will be using once per month, so the chance of forgeting gets pretty low after the first week.
So my vote goes to get rid of text, it wastes valuable gui space in an environment where windows fight for space. And even on my 27'' monitor I rather have as compact as possible GUI.
On Sat, Jan 9, 2016 at 3:05 PM stepharo <stepharo@free.fr> wrote:
Le 9/1/16 11:01, Esteban Lorenzano a écrit :
again re-send because of exceed limits with the image (thatâs new?)
with a small tweak, texts (AND icons :P):
And text. I asked that during two years in GT but I was told it was not possible. Like that I do not have to learn these icons What is the Where is?
<Pièce jointe Mail.png>
would that be aceptable for you?
cheers! Esteban
On 09 Jan 2016, at 09:43, Esteban Lorenzano <estebanlm@gmail.com> wrote:
(re-send because I exceeded limit.)
Hi,
letâs think positive. the GTDebugger is a step forward⦠it allow a lot of better interactions and of course, it needs some iterations to make it appealing to everybody. For instance, I took me 2â to tweak the debugger presentation and to get this:
<Screen Shot 2016-01-09 at 09.29.59.png>
(I changed all available⦠is a trivial task)
and like IMO feels a lot better⦠and I think is a good compromise between the old and the new. Reasons to suggest this approach:
- it keeps old approach who(I think) was good (I can see the stack, and the flow feels natural from top to down) - it preserves âthe importantâ (the code) as central. - it gives space for adding columns (like the bytecode).
Now⦠I can understand you want icons with text, and that can be hacked tooâ¦
So⦠can we have an agreement?
Esteban
ps: btw⦠using GT with Fast Table we can also avoid those annoying paginated lists too
On 09 Jan 2016, at 08:53, stepharo <stepharo@free.fr> wrote:
Thanks for your testimony.
I'm not against GTDebugger per se. I believe that we should have better tools but we should take time for building better tools (even if this is two years that moosers use or not this new debugger). I would appreciate a process where users can give real feedback and we can simplify/shape our tools nicely.
Now for the mooc I will not present GTDebugger. So students will not use Pharo 50
Stef
Le 08/01/2016 21:22, stepharo a écrit :
I'm sorry but this debugger should not be the default one. MONDAY we are filming our mooc and we have to explain the debugger and personally I do not see the gain: - It looks a lot more complex to me and I do not want to have to redo all the screenshots of our lecture. - Just that I have to learn the meaning of small icons. - Why do we need a special pane for the evaluator - Why there is a type column. - Sorry but I'm not convinced about the moldable aspect behind the story (no need to argue I know it)
I would like to avoid to be forced to use not the latest version of Pharo for the mooc.
Such changes are arriving far too late in the release. We do not change the debugger itself the day of code freeze.
We decided that the GTDebugger can be included but to me it never meant that it should be the default one. I think that experts can choose the debugger they want. The newbies don't.
Stef
IMO the old debugger is way more intuitive. When I used the debugger of Eclipse for java I was lost. When I used Spec debugger I thought "Oh, this is not so hard in fact". And I lose the feeling with GTDebugger. And the debugger is one of the main source of interest for newbies.
Maybe we could have a button on the spec Debugger "Switch to GTDebugger"?
Dont do it for me , what I did with ChronosManager is only the tip of the iceberg, I will be redesigning the whole Pharo GUI from scratch. After I release ChronosManager 0.2 my next victim will be Nautilus, then inspector and finally debugger. So I will be building my own GUI for the debugger anyway, in similar style to ChronosManager, completely custom made , static and icon based. It wont happen tommorow but slowly and steadily I will make my own Pharo GUI, obviously radically different to what we have now. I merely mentioned this to represent a voice of reason over icon based interfaces that dominate software market anyway. On Sat, Jan 9, 2016 at 3:49 PM Christophe Demarey < Christophe.Demarey@inria.fr> wrote:
Hi,
It is impossible to satisfy everyone. What I would suggest is to have text + icons as default and a preference to only have icons.
Christophe
Le 9 janv. 2016 à 14:30, Dimitris Chloupis a écrit :
Which brings us to my question, where did tooltips go ? Squeak had them and then they were gone in pharo.
Personally I dont see the point of having an icon to have text next to it. Seriously how much time it takes you to learn what each icon does ?
and the debugger is not exactly a tool you will be using once per month, so the chance of forgeting gets pretty low after the first week.
So my vote goes to get rid of text, it wastes valuable gui space in an environment where windows fight for space. And even on my 27'' monitor I rather have as compact as possible GUI.
On Sat, Jan 9, 2016 at 3:05 PM stepharo <stepharo@free.fr> wrote:
Le 9/1/16 11:01, Esteban Lorenzano a écrit :
again re-send because of exceed limits with the image (thatâs new?)
with a small tweak, texts (AND icons :P):
And text. I asked that during two years in GT but I was told it was not possible. Like that I do not have to learn these icons What is the Where is?
<Pièce jointe Mail.png>
would that be aceptable for you?
cheers! Esteban
On 09 Jan 2016, at 09:43, Esteban Lorenzano <estebanlm@gmail.com> wrote:
(re-send because I exceeded limit.)
Hi,
letâs think positive. the GTDebugger is a step forward⦠it allow a lot of better interactions and of course, it needs some iterations to make it appealing to everybody. For instance, I took me 2â to tweak the debugger presentation and to get this:
<Screen Shot 2016-01-09 at 09.29.59.png>
(I changed all available⦠is a trivial task)
and like IMO feels a lot better⦠and I think is a good compromise between the old and the new. Reasons to suggest this approach:
- it keeps old approach who(I think) was good (I can see the stack, and the flow feels natural from top to down) - it preserves âthe importantâ (the code) as central. - it gives space for adding columns (like the bytecode).
Now⦠I can understand you want icons with text, and that can be hacked tooâ¦
So⦠can we have an agreement?
Esteban
ps: btw⦠using GT with Fast Table we can also avoid those annoying paginated lists too
On 09 Jan 2016, at 08:53, stepharo <stepharo@free.fr> wrote:
Thanks for your testimony.
I'm not against GTDebugger per se. I believe that we should have better tools but we should take time for building better tools (even if this is two years that moosers use or not this new debugger). I would appreciate a process where users can give real feedback and we can simplify/shape our tools nicely.
Now for the mooc I will not present GTDebugger. So students will not use Pharo 50
Stef
Le 08/01/2016 21:22, stepharo a écrit :
I'm sorry but this debugger should not be the default one. MONDAY we are filming our mooc and we have to explain the debugger and personally I do not see the gain: - It looks a lot more complex to me and I do not want to have to redo all the screenshots of our lecture. - Just that I have to learn the meaning of small icons. - Why do we need a special pane for the evaluator - Why there is a type column. - Sorry but I'm not convinced about the moldable aspect behind the story (no need to argue I know it)
I would like to avoid to be forced to use not the latest version of Pharo for the mooc.
Such changes are arriving far too late in the release. We do not change the debugger itself the day of code freeze.
We decided that the GTDebugger can be included but to me it never meant that it should be the default one. I think that experts can choose the debugger they want. The newbies don't.
Stef
IMO the old debugger is way more intuitive. When I used the debugger of Eclipse for java I was lost. When I used Spec debugger I thought "Oh, this is not so hard in fact". And I lose the feeling with GTDebugger. And the debugger is one of the main source of interest for newbies.
Maybe we could have a button on the spec Debugger "Switch to GTDebugger"?

I wanted to say that I also like more the distribution that Esteban built instead of the original one of GT Debugger. So.. +1 for that. And yes, I also like the text besides the buttons since unfortunately the buttons are not extremely intuitive. +1 for that too. Stef, as for the bydecode debugger, if I remember, you had to explicitly switch to a bytecode debugger. In the normal debugger a normal user will use, the bytecode pane was not there. On Sat, Jan 9, 2016 at 11:08 AM, Dimitris Chloupis <kilon.alios@gmail.com> wrote:
Dont do it for me , what I did with ChronosManager is only the tip of the iceberg, I will be redesigning the whole Pharo GUI from scratch. After I release ChronosManager 0.2 my next victim will be Nautilus, then inspector and finally debugger. So I will be building my own GUI for the debugger anyway, in similar style to ChronosManager, completely custom made , static and icon based. It wont happen tommorow but slowly and steadily I will make my own Pharo GUI, obviously radically different to what we have now.
I merely mentioned this to represent a voice of reason over icon based interfaces that dominate software market anyway.
On Sat, Jan 9, 2016 at 3:49 PM Christophe Demarey < Christophe.Demarey@inria.fr> wrote:
Hi,
It is impossible to satisfy everyone. What I would suggest is to have text + icons as default and a preference to only have icons.
Christophe
Le 9 janv. 2016 à 14:30, Dimitris Chloupis a écrit :
Which brings us to my question, where did tooltips go ? Squeak had them and then they were gone in pharo.
Personally I dont see the point of having an icon to have text next to it. Seriously how much time it takes you to learn what each icon does ?
and the debugger is not exactly a tool you will be using once per month, so the chance of forgeting gets pretty low after the first week.
So my vote goes to get rid of text, it wastes valuable gui space in an environment where windows fight for space. And even on my 27'' monitor I rather have as compact as possible GUI.
On Sat, Jan 9, 2016 at 3:05 PM stepharo <stepharo@free.fr> wrote:
Le 9/1/16 11:01, Esteban Lorenzano a écrit :
again re-send because of exceed limits with the image (thatâs new?)
with a small tweak, texts (AND icons :P):
And text. I asked that during two years in GT but I was told it was not possible. Like that I do not have to learn these icons What is the Where is?
<Pièce jointe Mail.png>
would that be aceptable for you?
cheers! Esteban
On 09 Jan 2016, at 09:43, Esteban Lorenzano <estebanlm@gmail.com> wrote:
(re-send because I exceeded limit.)
Hi,
letâs think positive. the GTDebugger is a step forward⦠it allow a lot of better interactions and of course, it needs some iterations to make it appealing to everybody. For instance, I took me 2â to tweak the debugger presentation and to get this:
<Screen Shot 2016-01-09 at 09.29.59.png>
(I changed all available⦠is a trivial task)
and like IMO feels a lot better⦠and I think is a good compromise between the old and the new. Reasons to suggest this approach:
- it keeps old approach who(I think) was good (I can see the stack, and the flow feels natural from top to down) - it preserves âthe importantâ (the code) as central. - it gives space for adding columns (like the bytecode).
Now⦠I can understand you want icons with text, and that can be hacked tooâ¦
So⦠can we have an agreement?
Esteban
ps: btw⦠using GT with Fast Table we can also avoid those annoying paginated lists too
On 09 Jan 2016, at 08:53, stepharo <stepharo@free.fr> wrote:
Thanks for your testimony.
I'm not against GTDebugger per se. I believe that we should have better tools but we should take time for building better tools (even if this is two years that moosers use or not this new debugger). I would appreciate a process where users can give real feedback and we can simplify/shape our tools nicely.
Now for the mooc I will not present GTDebugger. So students will not use Pharo 50
Stef
Le 08/01/2016 21:22, stepharo a écrit :
I'm sorry but this debugger should not be the default one. MONDAY we are filming our mooc and we have to explain the debugger and personally I do not see the gain: - It looks a lot more complex to me and I do not want to have to redo all the screenshots of our lecture. - Just that I have to learn the meaning of small icons. - Why do we need a special pane for the evaluator - Why there is a type column. - Sorry but I'm not convinced about the moldable aspect behind the story (no need to argue I know it)
I would like to avoid to be forced to use not the latest version of Pharo for the mooc.
Such changes are arriving far too late in the release. We do not change the debugger itself the day of code freeze.
We decided that the GTDebugger can be included but to me it never meant that it should be the default one. I think that experts can choose the debugger they want. The newbies don't.
Stef
IMO the old debugger is way more intuitive. When I used the debugger of Eclipse for java I was lost. When I used Spec debugger I thought "Oh, this is not so hard in fact". And I lose the feeling with GTDebugger. And the debugger is one of the main source of interest for newbies.
Maybe we could have a button on the spec Debugger "Switch to GTDebugger"?
-- Mariano http://marianopeck.wordpress.com
I wanted to say that I also like more the distribution that Esteban built instead of the original one of GT Debugger. So.. +1 for that.
And yes, I also like the text besides the buttons since unfortunately the buttons are not extremely intuitive. +1 for that too.
For the record I gave this feedback two years ago. Fun to see that I'm so right.
Stef, as for the bydecode debugger, if I remember, you had to explicitly switch to a bytecode debugger. In the normal debugger a normal user will use, the bytecode pane was not there.
On Sat, Jan 9, 2016 at 11:08 AM, Dimitris Chloupis <kilon.alios@gmail.com <mailto:kilon.alios@gmail.com>> wrote:
Dont do it for me , what I did with ChronosManager is only the tip of the iceberg, I will be redesigning the whole Pharo GUI from scratch. After I release ChronosManager 0.2 my next victim will be Nautilus, then inspector and finally debugger. So I will be building my own GUI for the debugger anyway, in similar style to ChronosManager, completely custom made , static and icon based. It wont happen tommorow but slowly and steadily I will make my own Pharo GUI, obviously radically different to what we have now.
I merely mentioned this to represent a voice of reason over icon based interfaces that dominate software market anyway.
On Sat, Jan 9, 2016 at 3:49 PM Christophe Demarey <Christophe.Demarey@inria.fr <mailto:Christophe.Demarey@inria.fr>> wrote:
Hi,
It is impossible to satisfy everyone. What I would suggest is to have text + icons as default and a preference to only have icons.
Christophe
Le 9 janv. 2016 à 14:30, Dimitris Chloupis a écrit :
Which brings us to my question, where did tooltips go ? Squeak had them and then they were gone in pharo.
Personally I dont see the point of having an icon to have text next to it. Seriously how much time it takes you to learn what each icon does ?
and the debugger is not exactly a tool you will be using once per month, so the chance of forgeting gets pretty low after the first week.
So my vote goes to get rid of text, it wastes valuable gui space in an environment where windows fight for space. And even on my 27'' monitor I rather have as compact as possible GUI. On Sat, Jan 9, 2016 at 3:05 PM stepharo <stepharo@free.fr <mailto:stepharo@free.fr>> wrote:
Le 9/1/16 11:01, Esteban Lorenzano a écrit :
again re-send because of exceed limits with the image (thatâs new?)
with a small tweak, texts (AND icons :P):
And text. I asked that during two years in GT but I was told it was not possible. Like that I do not have to learn these icons What is the Where is?
<Pièce jointe Mail.png>
would that be aceptable for you?
cheers! Esteban
On 09 Jan 2016, at 09:43, Esteban Lorenzano <estebanlm@gmail.com <mailto:estebanlm@gmail.com>> wrote:
(re-send because I exceeded limit.)
Hi,
letâs think positive. the GTDebugger is a step forward⦠it allow a lot of better interactions and of course, it needs some iterations to make it appealing to everybody. For instance, I took me 2â to tweak the debugger presentation and to get this:
<Screen Shot 2016-01-09 at 09.29.59.png>
(I changed all available⦠is a trivial task)
and like IMO feels a lot better⦠and I think is a good compromise between the old and the new. Reasons to suggest this approach:
- it keeps old approach who(I think) was good (I can see the stack, and the flow feels natural from top to down) - it preserves âthe importantâ (the code) as central. - it gives space for adding columns (like the bytecode).
Now⦠I can understand you want icons with text, and that can be hacked tooâ¦
So⦠can we have an agreement?
Esteban
ps: btw⦠using GT with Fast Table we can also avoid those annoying paginated lists too
On 09 Jan 2016, at 08:53, stepharo <stepharo@free.fr <mailto:stepharo@free.fr>> wrote:
Thanks for your testimony.
I'm not against GTDebugger per se. I believe that we should have better tools but we should take time for building better tools (even if this is two years that moosers use or not this new debugger). I would appreciate a process where users can give real feedback and we can simplify/shape our tools nicely.
Now for the mooc I will not present GTDebugger. So students will not use Pharo 50
Stef
Le 08/01/2016 21:22, stepharo a écrit :
I'm sorry but this debugger should not be the default one. MONDAY we are filming our mooc and we have to explain the debugger and personally I do not see the gain: - It looks a lot more complex to me and I do not want to have to redo all the screenshots of our lecture. - Just that I have to learn the meaning of small icons. - Why do we need a special pane for the evaluator - Why there is a type column. - Sorry but I'm not convinced about the moldable aspect behind the story (no need to argue I know it)
I would like to avoid to be forced to use not the latest version of Pharo for the mooc.
Such changes are arriving far too late in the release. We do not change the debugger itself the day of code freeze.
We decided that the GTDebugger can be included but to me it never meant that it should be the default one. I think that experts can choose the debugger they want. The newbies don't.
Stef
IMO the old debugger is way more intuitive. When I used the debugger of Eclipse for java I was lost. When I used Spec debugger I thought "Oh, this is not so hard in fact". And I lose the feeling with GTDebugger. And the debugger is one of the main source of interest for newbies.
Maybe we could have a button on the spec Debugger "Switch to GTDebugger"?
-- Mariano http://marianopeck.wordpress.com
Not yet tested but looks good. I just noticed it misses the "run to here" action. Le 9 janv. 2016 à 11:01, Esteban Lorenzano a écrit :
again re-send because of exceed limits with the image (thatâs new?)
with a small tweak, texts (AND icons :P):
<Screen Shot 2016-01-09 at 10.59.20.png>
would that be aceptable for you?
cheers! Esteban
On 09 Jan 2016, at 09:43, Esteban Lorenzano <estebanlm@gmail.com> wrote:
(re-send because I exceeded limit.)
Hi,
letâs think positive. the GTDebugger is a step forward⦠it allow a lot of better interactions and of course, it needs some iterations to make it appealing to everybody. For instance, I took me 2â to tweak the debugger presentation and to get this:
<Screen Shot 2016-01-09 at 09.29.59.png>
(I changed all available⦠is a trivial task)
and like IMO feels a lot better⦠and I think is a good compromise between the old and the new. Reasons to suggest this approach:
- it keeps old approach who(I think) was good (I can see the stack, and the flow feels natural from top to down) - it preserves âthe importantâ (the code) as central. - it gives space for adding columns (like the bytecode).
Now⦠I can understand you want icons with text, and that can be hacked tooâ¦
So⦠can we have an agreement?
Esteban
ps: btw⦠using GT with Fast Table we can also avoid those annoying paginated lists too
On 09 Jan 2016, at 08:53, stepharo <stepharo@free.fr> wrote:
Thanks for your testimony.
I'm not against GTDebugger per se. I believe that we should have better tools but we should take time for building better tools (even if this is two years that moosers use or not this new debugger). I would appreciate a process where users can give real feedback and we can simplify/shape our tools nicely.
Now for the mooc I will not present GTDebugger. So students will not use Pharo 50
Stef
Le 08/01/2016 21:22, stepharo a écrit :
I'm sorry but this debugger should not be the default one. MONDAY we are filming our mooc and we have to explain the debugger and personally I do not see the gain: - It looks a lot more complex to me and I do not want to have to redo all the screenshots of our lecture. - Just that I have to learn the meaning of small icons. - Why do we need a special pane for the evaluator - Why there is a type column. - Sorry but I'm not convinced about the moldable aspect behind the story (no need to argue I know it)
I would like to avoid to be forced to use not the latest version of Pharo for the mooc.
Such changes are arriving far too late in the release. We do not change the debugger itself the day of code freeze.
We decided that the GTDebugger can be included but to me it never meant that it should be the default one. I think that experts can choose the debugger they want. The newbies don't.
Stef
IMO the old debugger is way more intuitive. When I used the debugger of Eclipse for java I was lost. When I used Spec debugger I thought "Oh, this is not so hard in fact". And I lose the feeling with GTDebugger. And the debugger is one of the main source of interest for newbies.
Maybe we could have a button on the spec Debugger "Switch to GTDebugger"?
Hi,
On Jan 9, 2016, at 3:29 PM, Christophe Demarey <christophe.demarey@inria.fr> wrote:
Not yet tested but looks good.
Thanks.
I just noticed it misses the "run to here" action.
It does not miss it. It is in the context menu of the code (this is where it logically belongs). Doru
Le 9 janv. 2016 à 11:01, Esteban Lorenzano a écrit :
again re-send because of exceed limits with the image (thatâs new?)
with a small tweak, texts (AND icons :P):
<Screen Shot 2016-01-09 at 10.59.20.png>
would that be aceptable for you?
cheers! Esteban
On 09 Jan 2016, at 09:43, Esteban Lorenzano <estebanlm@gmail.com> wrote:
(re-send because I exceeded limit.)
Hi,
letâs think positive. the GTDebugger is a step forward⦠it allow a lot of better interactions and of course, it needs some iterations to make it appealing to everybody. For instance, I took me 2â to tweak the debugger presentation and to get this:
<Screen Shot 2016-01-09 at 09.29.59.png>
(I changed all available⦠is a trivial task)
and like IMO feels a lot better⦠and I think is a good compromise between the old and the new. Reasons to suggest this approach:
- it keeps old approach who(I think) was good (I can see the stack, and the flow feels natural from top to down) - it preserves âthe importantâ (the code) as central. - it gives space for adding columns (like the bytecode).
Now⦠I can understand you want icons with text, and that can be hacked tooâ¦
So⦠can we have an agreement?
Esteban
ps: btw⦠using GT with Fast Table we can also avoid those annoying paginated lists too
On 09 Jan 2016, at 08:53, stepharo <stepharo@free.fr> wrote:
Thanks for your testimony.
I'm not against GTDebugger per se. I believe that we should have better tools but we should take time for building better tools (even if this is two years that moosers use or not this new debugger). I would appreciate a process where users can give real feedback and we can simplify/shape our tools nicely.
Now for the mooc I will not present GTDebugger. So students will not use Pharo 50
Stef
Le 08/01/2016 21:22, stepharo a écrit :
I'm sorry but this debugger should not be the default one. MONDAY we are filming our mooc and we have to explain the debugger and personally I do not see the gain: - It looks a lot more complex to me and I do not want to have to redo all the screenshots of our lecture. - Just that I have to learn the meaning of small icons. - Why do we need a special pane for the evaluator - Why there is a type column. - Sorry but I'm not convinced about the moldable aspect behind the story (no need to argue I know it)
I would like to avoid to be forced to use not the latest version of Pharo for the mooc.
Such changes are arriving far too late in the release. We do not change the debugger itself the day of code freeze.
We decided that the GTDebugger can be included but to me it never meant that it should be the default one. I think that experts can choose the debugger they want. The newbies don't.
Stef
IMO the old debugger is way more intuitive. When I used the debugger of Eclipse for java I was lost. When I used Spec debugger I thought "Oh, this is not so hard in fact". And I lose the feeling with GTDebugger. And the debugger is one of the main source of interest for newbies.
Maybe we could have a button on the spec Debugger "Switch to GTDebugger"?
-- www.tudorgirba.com www.feenk.com "Quality cannot be an afterthought."
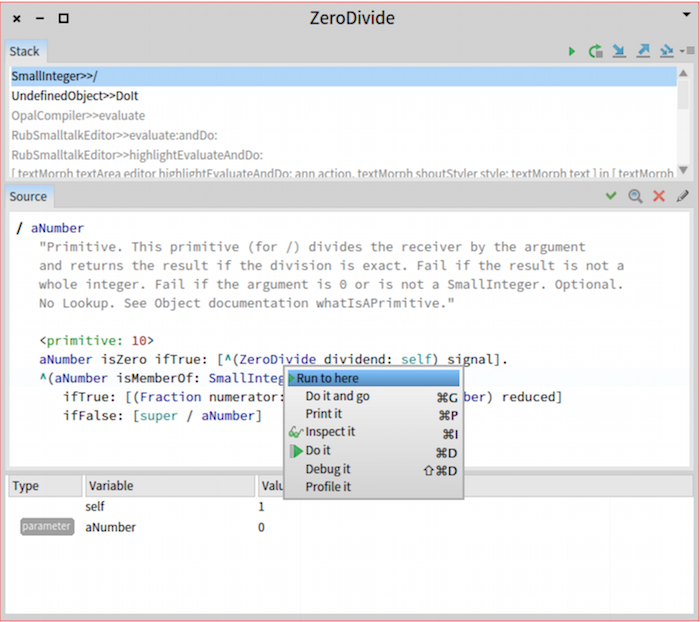
2016-01-09 23:10 GMT+01:00 Tudor Girba <tudor@tudorgirba.com>:
Hi,
On Jan 9, 2016, at 3:29 PM, Christophe Demarey < christophe.demarey@inria.fr> wrote:
Not yet tested but looks good.
Thanks.
I just noticed it misses the "run to here" action.
It does not miss it. It is in the context menu of the code (this is where it logically belongs).
Argh, trying to change a "well known user interface" (SpecDebugger) and arguing about why the new interface (GTDebugger) is " more logical" is always risky :) Even so we (smalltalkers) have the best software environment (Pharo) we are bound to our owns habits. And it is a question of "discoverability". If you only see 5 debugger action icons, you may not know that there is another one (hidden) inthe context menu.
Doru
Le 9 janv. 2016 à 11:01, Esteban Lorenzano a écrit :
again re-send because of exceed limits with the image (thatâs new?)
with a small tweak, texts (AND icons :P):
<Screen Shot 2016-01-09 at 10.59.20.png>
would that be aceptable for you?
cheers! Esteban
On 09 Jan 2016, at 09:43, Esteban Lorenzano <estebanlm@gmail.com> wrote:
(re-send because I exceeded limit.)
Hi,
letâs think positive. the GTDebugger is a step forward⦠it allow a lot of better interactions and of course, it needs some iterations to make it appealing to everybody. For instance, I took me 2â to tweak the debugger presentation and to get this:
<Screen Shot 2016-01-09 at 09.29.59.png>
(I changed all available⦠is a trivial task)
and like IMO feels a lot better⦠and I think is a good compromise between the old and the new. Reasons to suggest this approach:
- it keeps old approach who(I think) was good (I can see the stack, and the flow feels natural from top to down) - it preserves âthe importantâ (the code) as central. - it gives space for adding columns (like the bytecode).
Now⦠I can understand you want icons with text, and that can be hacked tooâ¦
So⦠can we have an agreement?
Esteban
ps: btw⦠using GT with Fast Table we can also avoid those annoying paginated lists too
On 09 Jan 2016, at 08:53, stepharo <stepharo@free.fr> wrote:
Thanks for your testimony.
I'm not against GTDebugger per se. I believe that we should have better tools but we should take time for building better tools (even if this is two years that moosers use or not this new debugger). I would appreciate a process where users can give real feedback and we can simplify/shape our tools nicely.
Now for the mooc I will not present GTDebugger. So students will not use Pharo 50
Stef
Le 08/01/2016 21:22, stepharo a écrit :
I'm sorry but this debugger should not be the default one. MONDAY we are filming our mooc and we have to explain the debugger and personally I do not see the gain: - It looks a lot more complex to me and I do not want to have to redo all the screenshots of our lecture. - Just that I have to learn the meaning of small icons. - Why do we need a special pane for the evaluator - Why there is a type column. - Sorry but I'm not convinced about the moldable aspect behind the story (no need to argue I know it)
I would like to avoid to be forced to use not the latest version of Pharo for the mooc.
Such changes are arriving far too late in the release. We do not change the debugger itself the day of code freeze.
We decided that the GTDebugger can be included but to me it never meant that it should be the default one. I think that experts can choose the debugger they want. The newbies don't.
Stef
IMO the old debugger is way more intuitive. When I used the debugger of Eclipse for java I was lost. When I used Spec debugger I thought "Oh, this is not so hard in fact". And I lose the feeling with GTDebugger. And the debugger is one of the main source of interest for newbies.
Maybe we could have a button on the spec Debugger "Switch to GTDebugger"?
-- www.tudorgirba.com www.feenk.com
"Quality cannot be an afterthought."
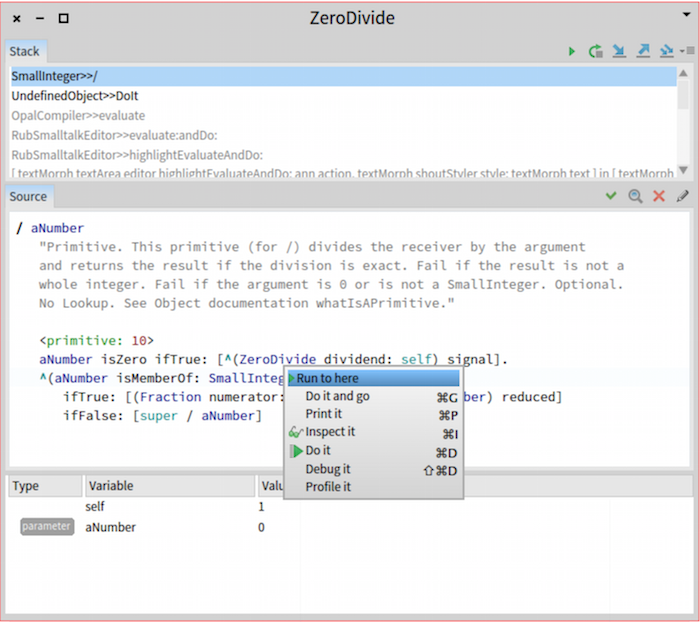
Hi,
On Jan 10, 2016, at 11:58 AM, Nicolai Hess <nicolaihess@gmail.com> wrote:
2016-01-09 23:10 GMT+01:00 Tudor Girba <tudor@tudorgirba.com>: Hi,
On Jan 9, 2016, at 3:29 PM, Christophe Demarey <christophe.demarey@inria.fr> wrote:
Not yet tested but looks good.
Thanks.
I just noticed it misses the "run to here" action.
It does not miss it. It is in the context menu of the code (this is where it logically belongs).
Argh, trying to change a "well known user interface" (SpecDebugger) and arguing about why the new interface (GTDebugger) is " more logical" is always risky :)
Tell me about risky :). But, I was not arguing. I just said why we chose to add it where it is. However, in Glamour the rule is that we have global actions as buttons, and contextual ones as contextual menus. This is used consistently in the inspector and playground, and it can be used as consistently to the debugger as well :).
Even so we (smalltalkers) have the best software environment (Pharo) we are bound to our owns habits. And it is a question of "discoverability". If you only see 5 debugger action icons, you may not know that there is another one (hidden) inthe context menu.
I am convinced it is the habits. Just consider this. The contextual menus of the spec debugger have several dozen actions. Also, the previous inspector had no visual actions. You see, if we would have such a strong set of design principles, we would have seen it. One goal with GT is to provide a small set of conventions that you can learn. They are clearly not the best, but once they are adopted in every tool, it should be better than the current state of affairs. And then we can iterate, but my stand is that we first have to reach a uniform enough situation. Anyway, I do not want to have a religious debate. But, I also think that if we impose the condition that new things should be exactly like the old ones we have a high chance of staying the same forever :). Cheers, Doru
<Untitled.png>
Doru
Le 9 janv. 2016 à 11:01, Esteban Lorenzano a écrit :
again re-send because of exceed limits with the image (thatâs new?)
with a small tweak, texts (AND icons :P):
<Screen Shot 2016-01-09 at 10.59.20.png>
would that be aceptable for you?
cheers! Esteban
On 09 Jan 2016, at 09:43, Esteban Lorenzano <estebanlm@gmail.com> wrote:
(re-send because I exceeded limit.)
Hi,
letâs think positive. the GTDebugger is a step forward⦠it allow a lot of better interactions and of course, it needs some iterations to make it appealing to everybody. For instance, I took me 2â to tweak the debugger presentation and to get this:
<Screen Shot 2016-01-09 at 09.29.59.png>
(I changed all available⦠is a trivial task)
and like IMO feels a lot better⦠and I think is a good compromise between the old and the new. Reasons to suggest this approach:
- it keeps old approach who(I think) was good (I can see the stack, and the flow feels natural from top to down) - it preserves âthe importantâ (the code) as central. - it gives space for adding columns (like the bytecode).
Now⦠I can understand you want icons with text, and that can be hacked tooâ¦
So⦠can we have an agreement?
Esteban
ps: btw⦠using GT with Fast Table we can also avoid those annoying paginated lists too
On 09 Jan 2016, at 08:53, stepharo <stepharo@free.fr> wrote:
Thanks for your testimony.
I'm not against GTDebugger per se. I believe that we should have better tools but we should take time for building better tools (even if this is two years that moosers use or not this new debugger). I would appreciate a process where users can give real feedback and we can simplify/shape our tools nicely.
Now for the mooc I will not present GTDebugger. So students will not use Pharo 50
Stef
Le 08/01/2016 21:22, stepharo a écrit :
I'm sorry but this debugger should not be the default one. MONDAY we are filming our mooc and we have to explain the debugger and personally I do not see the gain: - It looks a lot more complex to me and I do not want to have to redo all the screenshots of our lecture. - Just that I have to learn the meaning of small icons. - Why do we need a special pane for the evaluator - Why there is a type column. - Sorry but I'm not convinced about the moldable aspect behind the story (no need to argue I know it)
I would like to avoid to be forced to use not the latest version of Pharo for the mooc.
Such changes are arriving far too late in the release. We do not change the debugger itself the day of code freeze.
We decided that the GTDebugger can be included but to me it never meant that it should be the default one. I think that experts can choose the debugger they want. The newbies don't.
Stef
IMO the old debugger is way more intuitive. When I used the debugger of Eclipse for java I was lost. When I used Spec debugger I thought "Oh, this is not so hard in fact". And I lose the feeling with GTDebugger. And the debugger is one of the main source of interest for newbies.
Maybe we could have a button on the spec Debugger "Switch to GTDebugger"?
-- www.tudorgirba.com www.feenk.com
"Quality cannot be an afterthought."
-- www.tudorgirba.com www.feenk.com "To utilize feedback, you first have to acquire it."
Yes this is my point
On Jan 9, 2016, at 3:29 PM, Christophe Demarey <christophe.demarey@inria.fr <mailto:christophe.demarey@inria.fr>> wrote:
Not yet tested but looks good.
Thanks.
I just noticed it misses the "run to here" action.
It does not miss it. It is in the context menu of the code (this is where it logically belongs).
Argh, trying to change a "well known user interface" (SpecDebugger) and arguing about why the new interface (GTDebugger) is " more logical" is always risky :)
Even so we (smalltalkers) have the best software environment (Pharo) we are bound to our owns habits. And it is a question of "discoverability". If you only see 5 debugger action icons, you may not know that there is another one (hidden) inthe context menu.
Le 9 janv. 2016 à 23:10, Tudor Girba a écrit :
Hi,
On Jan 9, 2016, at 3:29 PM, Christophe Demarey <christophe.demarey@inria.fr> wrote:
Not yet tested but looks good.
Thanks.
I just noticed it misses the "run to here" action.
It does not miss it. It is in the context menu of the code (this is where it logically belongs).
ah, good! I also have to confess that it is important that this action (as well as other "hidden" action) can be discoverable as stated by Nicolai and Stef. Of course, we do not want a button for all actions (only the important ones and the ones used very often) but it is important to visually see that there are other actions available (BTW, I do not know the best way to reach this goal)
Thanks for this. Part of it is now in the repo. We need to work to find a reasonable solution to add text to Glamour. Cheers, Doru
On Jan 9, 2016, at 12:01 PM, Esteban Lorenzano <estebanlm@gmail.com> wrote:
again re-send because of exceed limits with the image (thatâs new?)
with a small tweak, texts (AND icons :P):
<Screen Shot 2016-01-09 at 10.59.20.png>
would that be aceptable for you?
cheers! Esteban
On 09 Jan 2016, at 09:43, Esteban Lorenzano <estebanlm@gmail.com> wrote:
(re-send because I exceeded limit.)
Hi,
letâs think positive. the GTDebugger is a step forward⦠it allow a lot of better interactions and of course, it needs some iterations to make it appealing to everybody. For instance, I took me 2â to tweak the debugger presentation and to get this:
<Screen Shot 2016-01-09 at 09.29.59.png>
(I changed all available⦠is a trivial task)
and like IMO feels a lot better⦠and I think is a good compromise between the old and the new. Reasons to suggest this approach:
- it keeps old approach who(I think) was good (I can see the stack, and the flow feels natural from top to down) - it preserves âthe importantâ (the code) as central. - it gives space for adding columns (like the bytecode).
Now⦠I can understand you want icons with text, and that can be hacked tooâ¦
So⦠can we have an agreement?
Esteban
ps: btw⦠using GT with Fast Table we can also avoid those annoying paginated lists too
On 09 Jan 2016, at 08:53, stepharo <stepharo@free.fr> wrote:
Thanks for your testimony.
I'm not against GTDebugger per se. I believe that we should have better tools but we should take time for building better tools (even if this is two years that moosers use or not this new debugger). I would appreciate a process where users can give real feedback and we can simplify/shape our tools nicely.
Now for the mooc I will not present GTDebugger. So students will not use Pharo 50
Stef
Le 08/01/2016 21:22, stepharo a écrit :
I'm sorry but this debugger should not be the default one. MONDAY we are filming our mooc and we have to explain the debugger and personally I do not see the gain: - It looks a lot more complex to me and I do not want to have to redo all the screenshots of our lecture. - Just that I have to learn the meaning of small icons. - Why do we need a special pane for the evaluator - Why there is a type column. - Sorry but I'm not convinced about the moldable aspect behind the story (no need to argue I know it)
I would like to avoid to be forced to use not the latest version of Pharo for the mooc.
Such changes are arriving far too late in the release. We do not change the debugger itself the day of code freeze.
We decided that the GTDebugger can be included but to me it never meant that it should be the default one. I think that experts can choose the debugger they want. The newbies don't.
Stef
IMO the old debugger is way more intuitive. When I used the debugger of Eclipse for java I was lost. When I used Spec debugger I thought "Oh, this is not so hard in fact". And I lose the feeling with GTDebugger. And the debugger is one of the main source of interest for newbies.
Maybe we could have a button on the spec Debugger "Switch to GTDebugger"?
-- www.tudorgirba.com www.feenk.com "Things happen when they happen, not when you talk about them happening."
Why do we need an ugly Stack pane with all the buttons on the right? Le 9/1/16 09:43, Esteban Lorenzano a écrit :
(re-send because I exceeded limit.)
Hi,
letâs think positive. the GTDebugger is a step forward⦠it allow a lot of better interactions and of course, it needs some iterations to make it appealing to everybody. For instance, I took me 2â to tweak the debugger presentation and to get this:
(I changed all available⦠is a trivial task)
and like IMO feels a lot better⦠and I think is a good compromise between the old and the new. Reasons to suggest this approach:
- it keeps old approach who(I think) was good (I can see the stack, and the flow feels natural from top to down) - it preserves âthe importantâ (the code) as central. - it gives space for adding columns (like the bytecode).
Now⦠I can understand you want icons with text, and that can be hacked tooâ¦
So⦠can we have an agreement?
Esteban
ps: btw⦠using GT with Fast Table we can also avoid those annoying paginated lists too
On 09 Jan 2016, at 08:53, stepharo <stepharo@free.fr <mailto:stepharo@free.fr>> wrote:
Thanks for your testimony.
I'm not against GTDebugger per se. I believe that we should have better tools but we should take time for building better tools (even if this is two years that moosers use or not this new debugger). I would appreciate a process where users can give real feedback and we can simplify/shape our tools nicely.
Now for the mooc I will not present GTDebugger. So students will not use Pharo 50
Stef
Le 08/01/2016 21:22, stepharo a écrit :
I'm sorry but this debugger should not be the default one. MONDAY we are filming our mooc and we have to explain the debugger and personally I do not see the gain: - It looks a lot more complex to me and I do not want to have to redo all the screenshots of our lecture. - Just that I have to learn the meaning of small icons. - Why do we need a special pane for the evaluator - Why there is a type column. - Sorry but I'm not convinced about the moldable aspect behind the story (no need to argue I know it)
I would like to avoid to be forced to use not the latest version of Pharo for the mooc.
Such changes are arriving far too late in the release. We do not change the debugger itself the day of code freeze.
We decided that the GTDebugger can be included but to me it never meant that it should be the default one. I think that experts can choose the debugger they want. The newbies don't.
Stef
IMO the old debugger is way more intuitive. When I used the debugger of Eclipse for java I was lost. When I used Spec debugger I thought "Oh, this is not so hard in fact". And I lose the feeling with GTDebugger. And the debugger is one of the main source of interest for newbies.
Maybe we could have a button on the spec Debugger "Switch to GTDebugger"?
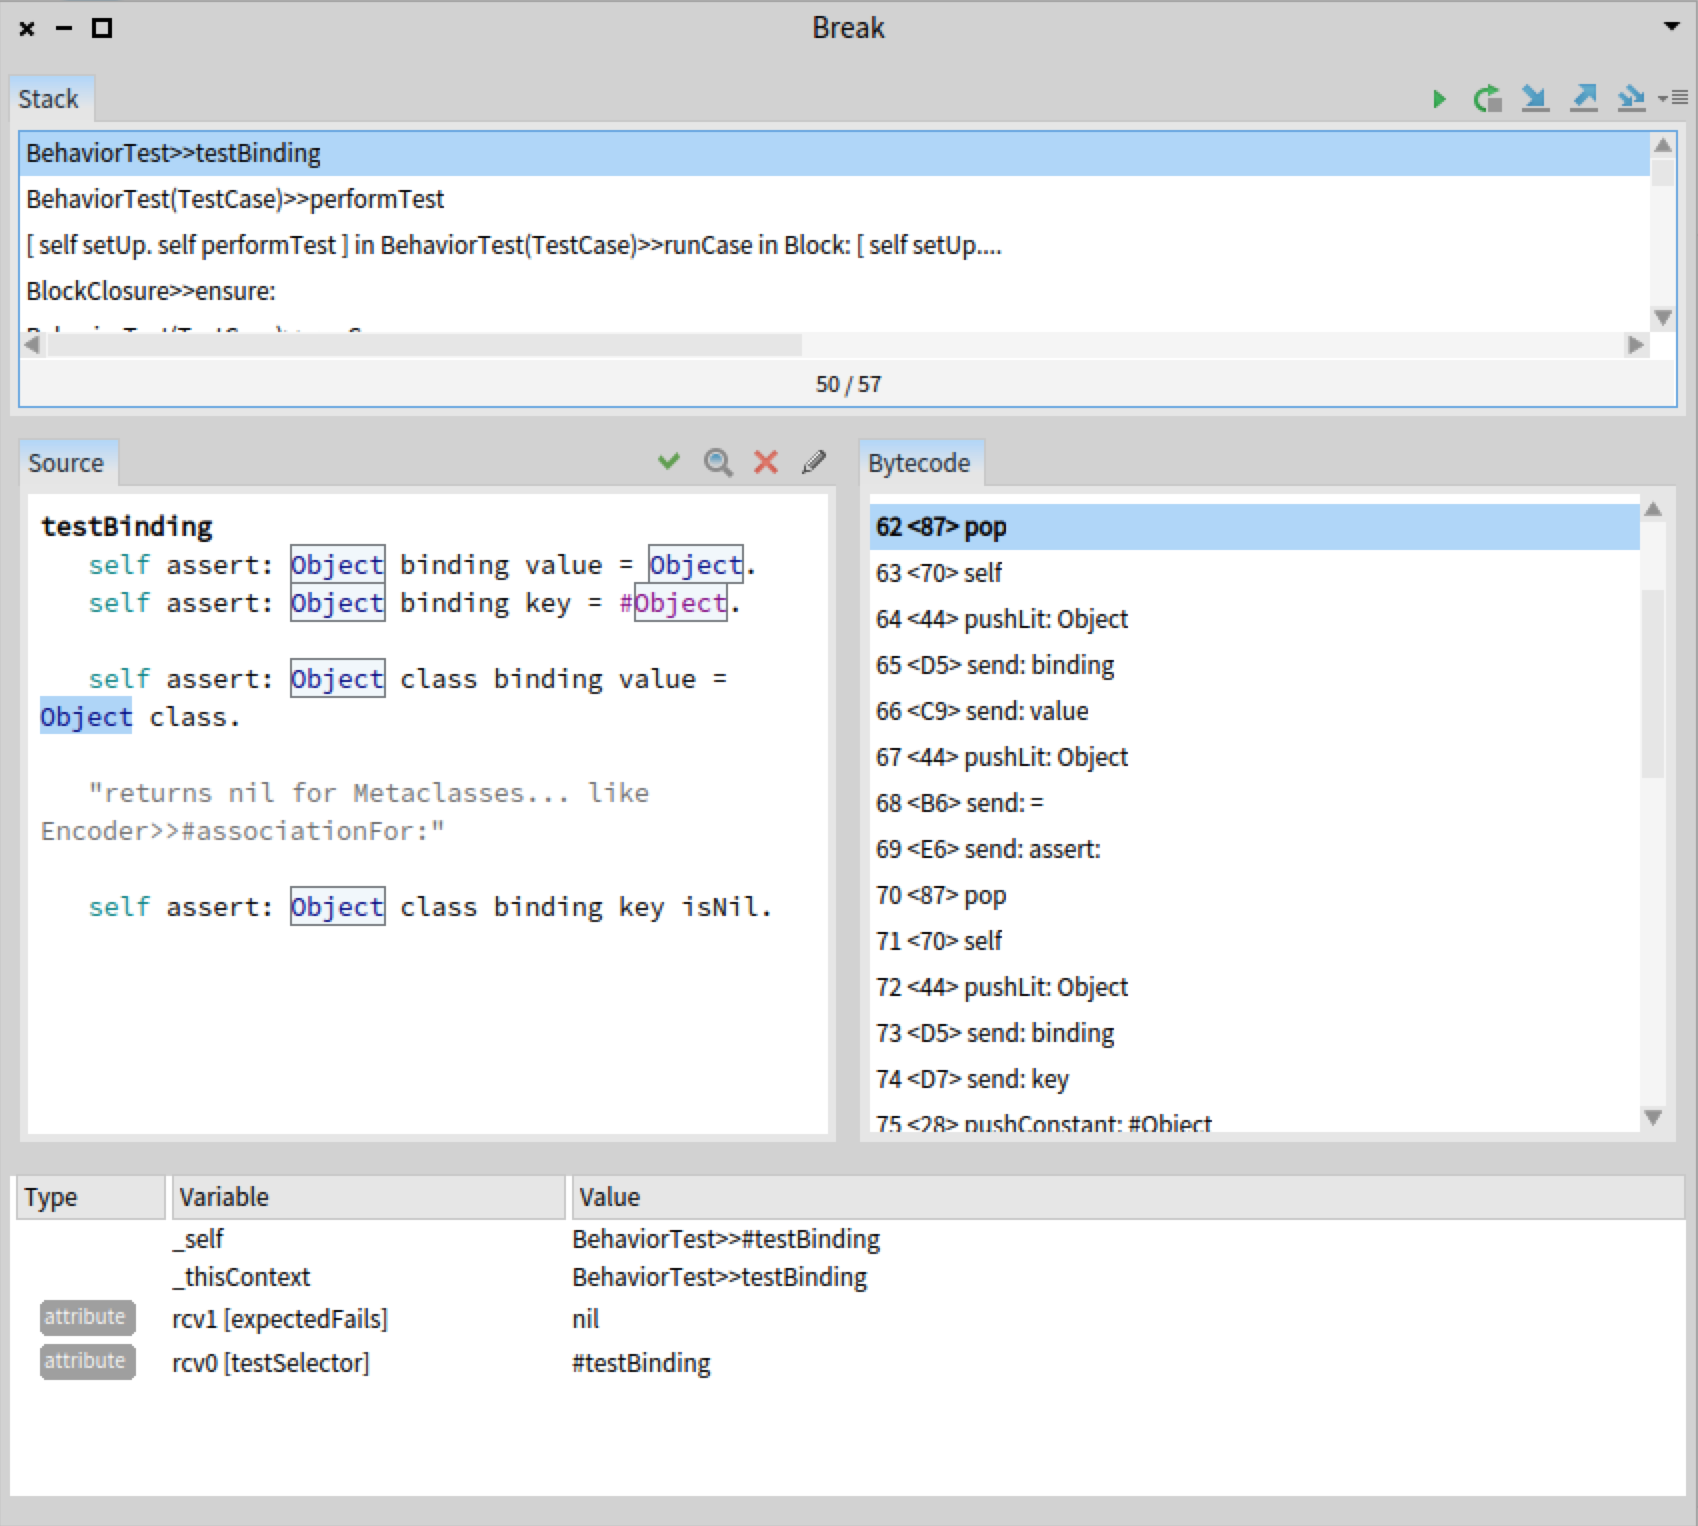
Why do we get bytecodes? Do you think that normal developpers do not care about bytecodes? Do you want me to show that to students? Seriously? Stef
Hi,
letâs think positive. the GTDebugger is a step forward⦠it allow a lot of better interactions and of course, it needs some iterations to make it appealing to everybody. For instance, I took me 2â to tweak the debugger presentation and to get this:
(I changed all available⦠is a trivial task)
and like IMO feels a lot better⦠and I think is a good compromise between the old and the new. Reasons to suggest this approach:
- it keeps old approach who(I think) was good (I can see the stack, and the flow feels natural from top to down) - it preserves âthe importantâ (the code) as central. - it gives space for adding columns (like the bytecode).
Now⦠I can understand you want icons with text, and that can be hacked tooâ¦
So⦠can we have an agreement?
Esteban
ps: btw⦠using GT with Fast Table we can also avoid those annoying paginated lists too
On 09 Jan 2016, at 08:53, stepharo <stepharo@free.fr <mailto:stepharo@free.fr>> wrote:
Thanks for your testimony.
I'm not against GTDebugger per se. I believe that we should have better tools but we should take time for building better tools (even if this is two years that moosers use or not this new debugger). I would appreciate a process where users can give real feedback and we can simplify/shape our tools nicely.
Now for the mooc I will not present GTDebugger. So students will not use Pharo 50
Stef
Le 08/01/2016 21:22, stepharo a écrit :
I'm sorry but this debugger should not be the default one. MONDAY we are filming our mooc and we have to explain the debugger and personally I do not see the gain: - It looks a lot more complex to me and I do not want to have to redo all the screenshots of our lecture. - Just that I have to learn the meaning of small icons. - Why do we need a special pane for the evaluator - Why there is a type column. - Sorry but I'm not convinced about the moldable aspect behind the story (no need to argue I know it)
I would like to avoid to be forced to use not the latest version of Pharo for the mooc.
Such changes are arriving far too late in the release. We do not change the debugger itself the day of code freeze.
We decided that the GTDebugger can be included but to me it never meant that it should be the default one. I think that experts can choose the debugger they want. The newbies don't.
Stef
IMO the old debugger is way more intuitive. When I used the debugger of Eclipse for java I was lost. When I used Spec debugger I thought "Oh, this is not so hard in fact". And I lose the feeling with GTDebugger. And the debugger is one of the main source of interest for newbies.
Maybe we could have a button on the spec Debugger "Switch to GTDebugger"?
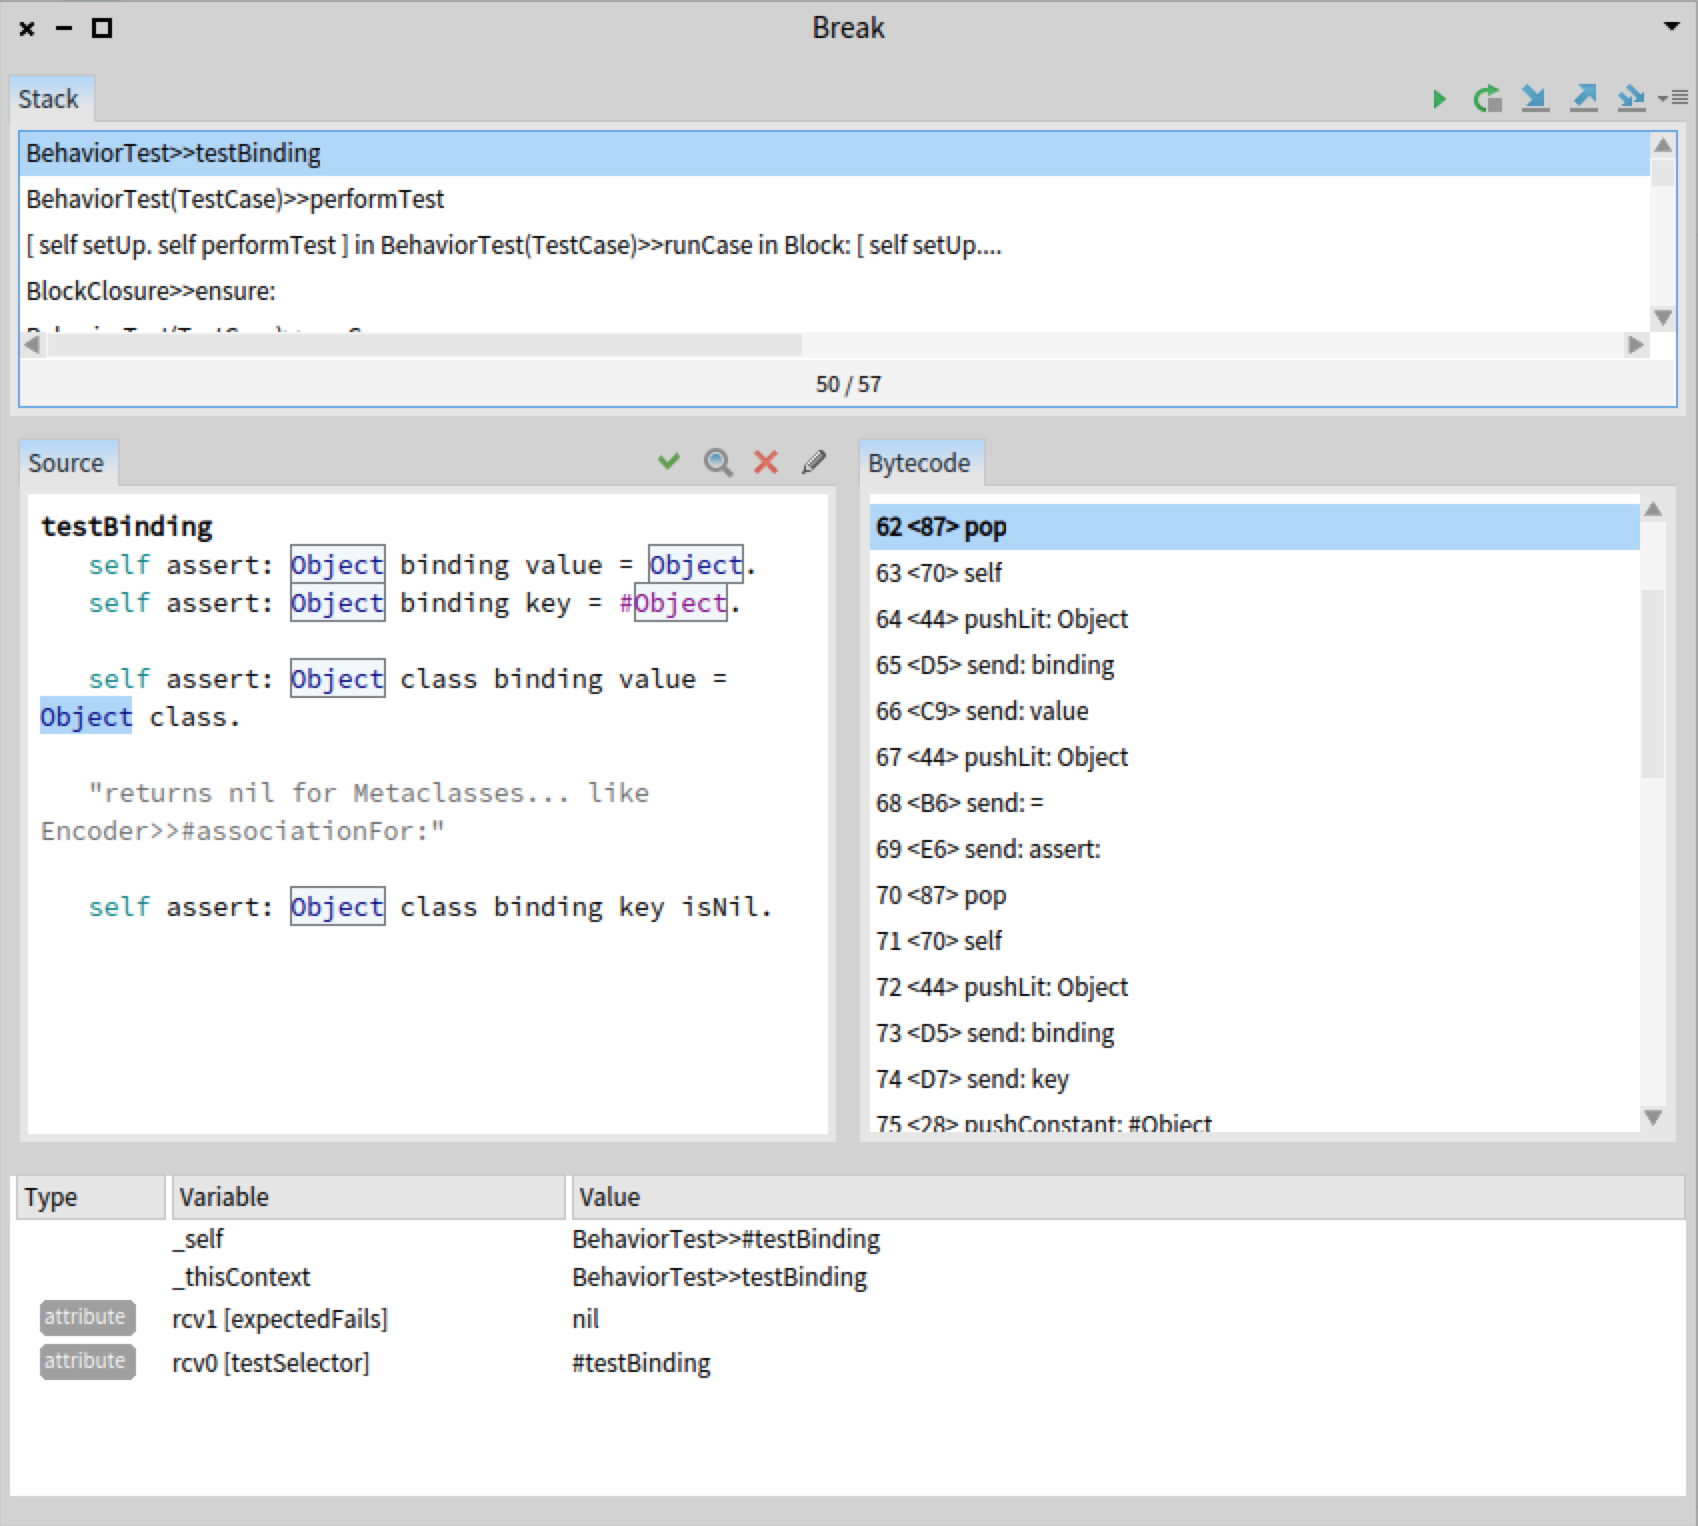
thatâs just an example, default debugger does not have it :) I will commit my changes as soon as I can sit and clean it⦠the actions need to be changed to make explicit if you want text/icon/both so we can keep all behaviours (and keep compatible). Esteban
On 09 Jan 2016, at 14:08, stepharo <stepharo@free.fr> wrote:
Why do we get bytecodes? Do you think that normal developpers do not care about bytecodes? Do you want me to show that to students? Seriously?
Stef
Hi,
letâs think positive. the GTDebugger is a step forward⦠it allow a lot of better interactions and of course, it needs some iterations to make it appealing to everybody. For instance, I took me 2â to tweak the debugger presentation and to get this:
<Mail Attachment.png>
(I changed all available⦠is a trivial task)
and like IMO feels a lot better⦠and I think is a good compromise between the old and the new. Reasons to suggest this approach:
- it keeps old approach who(I think) was good (I can see the stack, and the flow feels natural from top to down) - it preserves âthe importantâ (the code) as central. - it gives space for adding columns (like the bytecode).
Now⦠I can understand you want icons with text, and that can be hacked tooâ¦
So⦠can we have an agreement?
Esteban
ps: btw⦠using GT with Fast Table we can also avoid those annoying paginated lists too
On 09 Jan 2016, at 08:53, stepharo < <mailto:stepharo@free.fr>stepharo@free.fr <mailto:stepharo@free.fr>> wrote:
Thanks for your testimony.
I'm not against GTDebugger per se. I believe that we should have better tools but we should take time for building better tools (even if this is two years that moosers use or not this new debugger). I would appreciate a process where users can give real feedback and we can simplify/shape our tools nicely.
Now for the mooc I will not present GTDebugger. So students will not use Pharo 50
Stef
Le 08/01/2016 21:22, stepharo a écrit :
I'm sorry but this debugger should not be the default one. MONDAY we are filming our mooc and we have to explain the debugger and personally I do not see the gain: - It looks a lot more complex to me and I do not want to have to redo all the screenshots of our lecture. - Just that I have to learn the meaning of small icons. - Why do we need a special pane for the evaluator - Why there is a type column. - Sorry but I'm not convinced about the moldable aspect behind the story (no need to argue I know it)
I would like to avoid to be forced to use not the latest version of Pharo for the mooc.
Such changes are arriving far too late in the release. We do not change the debugger itself the day of code freeze.
We decided that the GTDebugger can be included but to me it never meant that it should be the default one. I think that experts can choose the debugger they want. The newbies don't.
Stef
IMO the old debugger is way more intuitive. When I used the debugger of Eclipse for java I was lost. When I used Spec debugger I thought "Oh, this is not so hard in fact". And I lose the feeling with GTDebugger. And the debugger is one of the main source of interest for newbies.
Maybe we could have a button on the spec Debugger "Switch to GTDebugger"?
On Sat, Jan 9, 2016 at 9:08 PM, stepharo <stepharo@free.fr> wrote:
Why do we get bytecodes?
Do you think that normal developpers do not care about bytecodes?
Do you want me to show that to students? Seriously?
I've never used the bytecodes view, but when I see them listed in the inspector on a method I still often think "Wow! You can do that?!" Its cool a hook to let novices peek under the hood and build a sense of mastery. Though I haven't used the GTDebugger for a long time, so I'm not sure whether my sentiment is applicable. cheers -ben
Stef
Hi,
letâs think positive. the GTDebugger is a step forward⦠it allow a lot of better interactions and of course, it needs some iterations to make it appealing to everybody. For instance, I took me 2â to tweak the debugger presentation and to get this:
(I changed all available⦠is a trivial task)
and like IMO feels a lot better⦠and I think is a good compromise between the old and the new. Reasons to suggest this approach:
- it keeps old approach who(I think) was good (I can see the stack, and the flow feels natural from top to down) - it preserves âthe importantâ (the code) as central. - it gives space for adding columns (like the bytecode).
Now⦠I can understand you want icons with text, and that can be hacked tooâ¦
So⦠can we have an agreement?
Esteban
ps: btw⦠using GT with Fast Table we can also avoid those annoying paginated lists too
On 09 Jan 2016, at 08:53, stepharo < <stepharo@free.fr>stepharo@free.fr> wrote:
Thanks for your testimony.
I'm not against GTDebugger per se. I believe that we should have better tools but we should take time for building better tools (even if this is two years that moosers use or not this new debugger). I would appreciate a process where users can give real feedback and we can simplify/shape our tools nicely.
Now for the mooc I will not present GTDebugger. So students will not use Pharo 50
Stef
Le 08/01/2016 21:22, stepharo a écrit :
I'm sorry but this debugger should not be the default one. MONDAY we are filming our mooc and we have to explain the debugger and personally I do not see the gain: - It looks a lot more complex to me and I do not want to have to redo all the screenshots of our lecture. - Just that I have to learn the meaning of small icons. - Why do we need a special pane for the evaluator - Why there is a type column. - Sorry but I'm not convinced about the moldable aspect behind the story (no need to argue I know it)
I would like to avoid to be forced to use not the latest version of Pharo for the mooc.
Such changes are arriving far too late in the release. We do not change the debugger itself the day of code freeze.
We decided that the GTDebugger can be included but to me it never meant that it should be the default one. I think that experts can choose the debugger they want. The newbies don't.
Stef
IMO the old debugger is way more intuitive. When I used the debugger of Eclipse for java I was lost. When I used Spec debugger I thought "Oh, this is not so hard in fact". And I lose the feeling with GTDebugger. And the debugger is one of the main source of interest for newbies.
Maybe we could have a button on the spec Debugger "Switch to GTDebugger"?
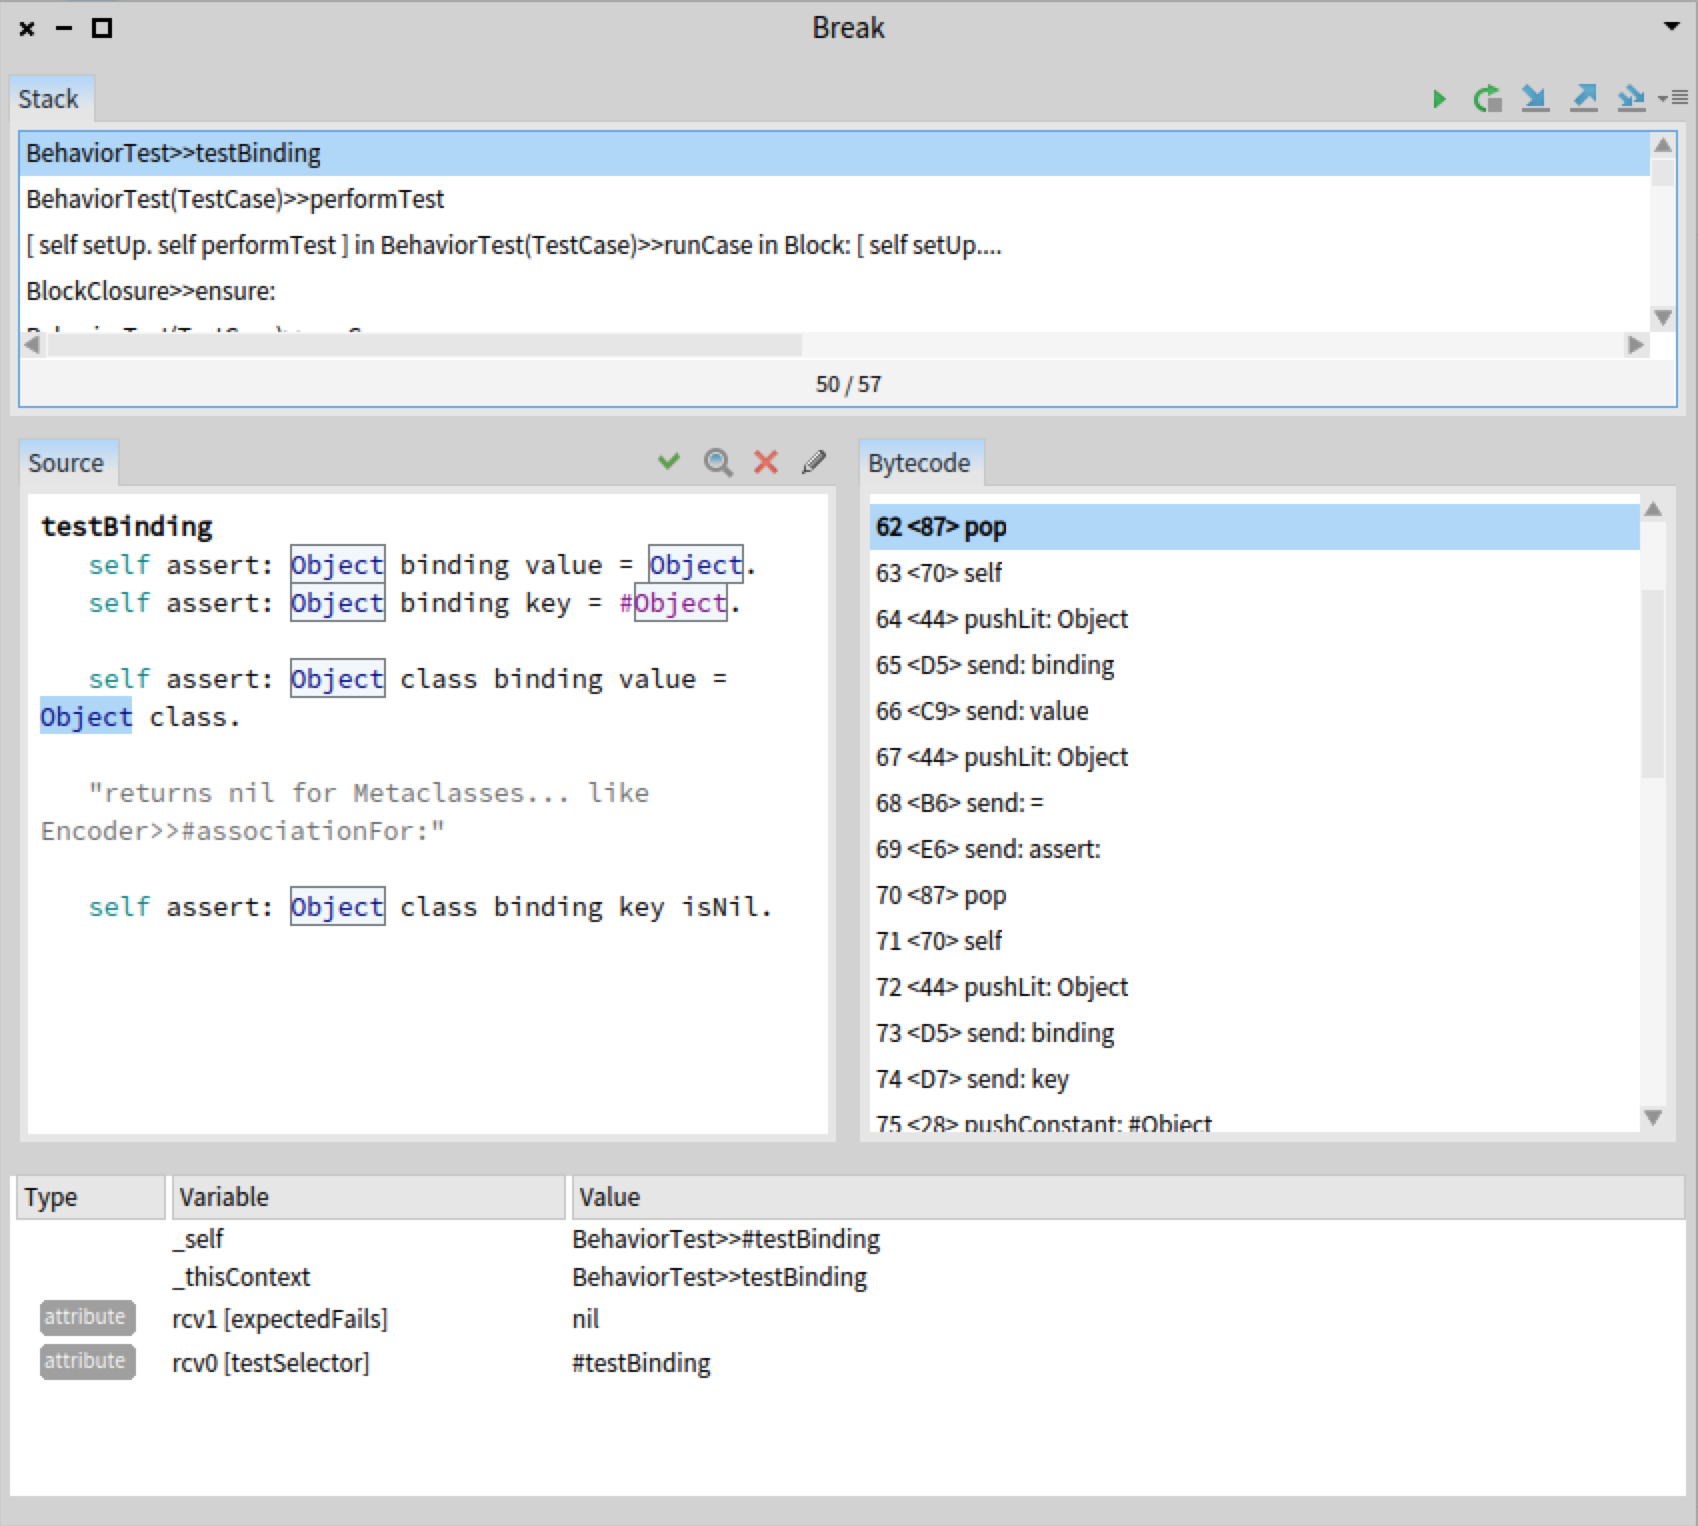
I've never used the bytecodes view, but when I see them listed in the inspector on a method I still often think "Wow! You can do that?!" Its cool a hook to let novices peek under the hood and build a sense of mastery. Though I haven't used the GTDebugger for a long time, so I'm not sure whether my sentiment is applicable. We are not facing the same novices then.
Mine are 3 years into programming at max. Stef
Can you remove this useless _stack top and _thisContext? Who needs that? And also the bytecode and also the Step glamour that freezes by image and the Step petitParser So you see what I mean? Something that normal people can use...
Hi, Could you be specific? What exactly do you find less intuitive? To be able to react, it is useful to get concrete points. Cheers, Doru
On Jan 9, 2016, at 4:23 AM, Ferlicot D. Cyril <cyril.ferlicot@gmail.com> wrote:
Le 08/01/2016 21:22, stepharo a écrit :
I'm sorry but this debugger should not be the default one. MONDAY we are filming our mooc and we have to explain the debugger and personally I do not see the gain: - It looks a lot more complex to me and I do not want to have to redo all the screenshots of our lecture. - Just that I have to learn the meaning of small icons. - Why do we need a special pane for the evaluator - Why there is a type column. - Sorry but I'm not convinced about the moldable aspect behind the story (no need to argue I know it)
I would like to avoid to be forced to use not the latest version of Pharo for the mooc.
Such changes are arriving far too late in the release. We do not change the debugger itself the day of code freeze.
We decided that the GTDebugger can be included but to me it never meant that it should be the default one. I think that experts can choose the debugger they want. The newbies don't.
Stef
IMO the old debugger is way more intuitive. When I used the debugger of Eclipse for java I was lost. When I used Spec debugger I thought "Oh, this is not so hard in fact". And I lose the feeling with GTDebugger. And the debugger is one of the main source of interest for newbies.
Maybe we could have a button on the spec Debugger "Switch to GTDebugger"?
-- Cyril Ferlicot
165 Avenue Bretagne Lille 59000 France
-- www.tudorgirba.com www.feenk.com "Value is always contextual."
Le 09/01/2016 10:32, Tudor Girba a écrit :
Hi,
Could you be specific? What exactly do you find less intuitive? To be able to react, it is useful to get concrete points.
Cheers, Doru
-- www.tudorgirba.com www.feenk.com
"Value is always contextual."
This was my impression but I will try to list these things. First I find the improvements of Esteban good. - For the icons it is true that the text help a lot. As someone mention, just a setting to get or not the text is possible, but a least be able to get the text is important IMO. I use Intellij for java debugging and sometime I get a little lost when I see the icons because for a same icon there is two different actions between Pharo and Intellij. So I lose always some time waiting the popup. And I think that a lot of students that do Java will have the same problem. - I like that the stack is fully loaded in the Spec debugger. In general that doesn't add this much time to show all the stack and it's one more line to show useful information. - On thing that I really don't like is to get 4 lines with the code of a block in the stack. This is too much space I think. And because of this we have a large horizontal scroll bar that we could avoid with a limite in character. I miss the fact that we had the name of the class on the line of a block in the Spec debugger. For example I will join a screen with a block. I would prefer something like: In GLMMorphicTabulatorRenderer: [ :index :each | each hasId ifTrue:... ] And if you use FTTable you will not even get the horizontal scrollbar, so it's useless to get 4 long lines of the block if we cannot see half of it. - There is no way to close the inspector if we miss click - I liked the separation between attributes and parameter/temp. I think that it was more readable. Before I could had a global overview of both easily. Now I have to scroll down to see the attributes. But for this one maybe I prefer the old one by habits. - The context menu of the spec debugger have more useful options (Suggestions, Code searchâ¦) These are the things that come in my mind. But maybe I missed some since the fact that I found the old debugger more intuitive was a feeling. It's hard to define why we have a feeling. -- Cyril Ferlicot http://www.synectique.eu 165 Avenue Bretagne Lille 59000 France
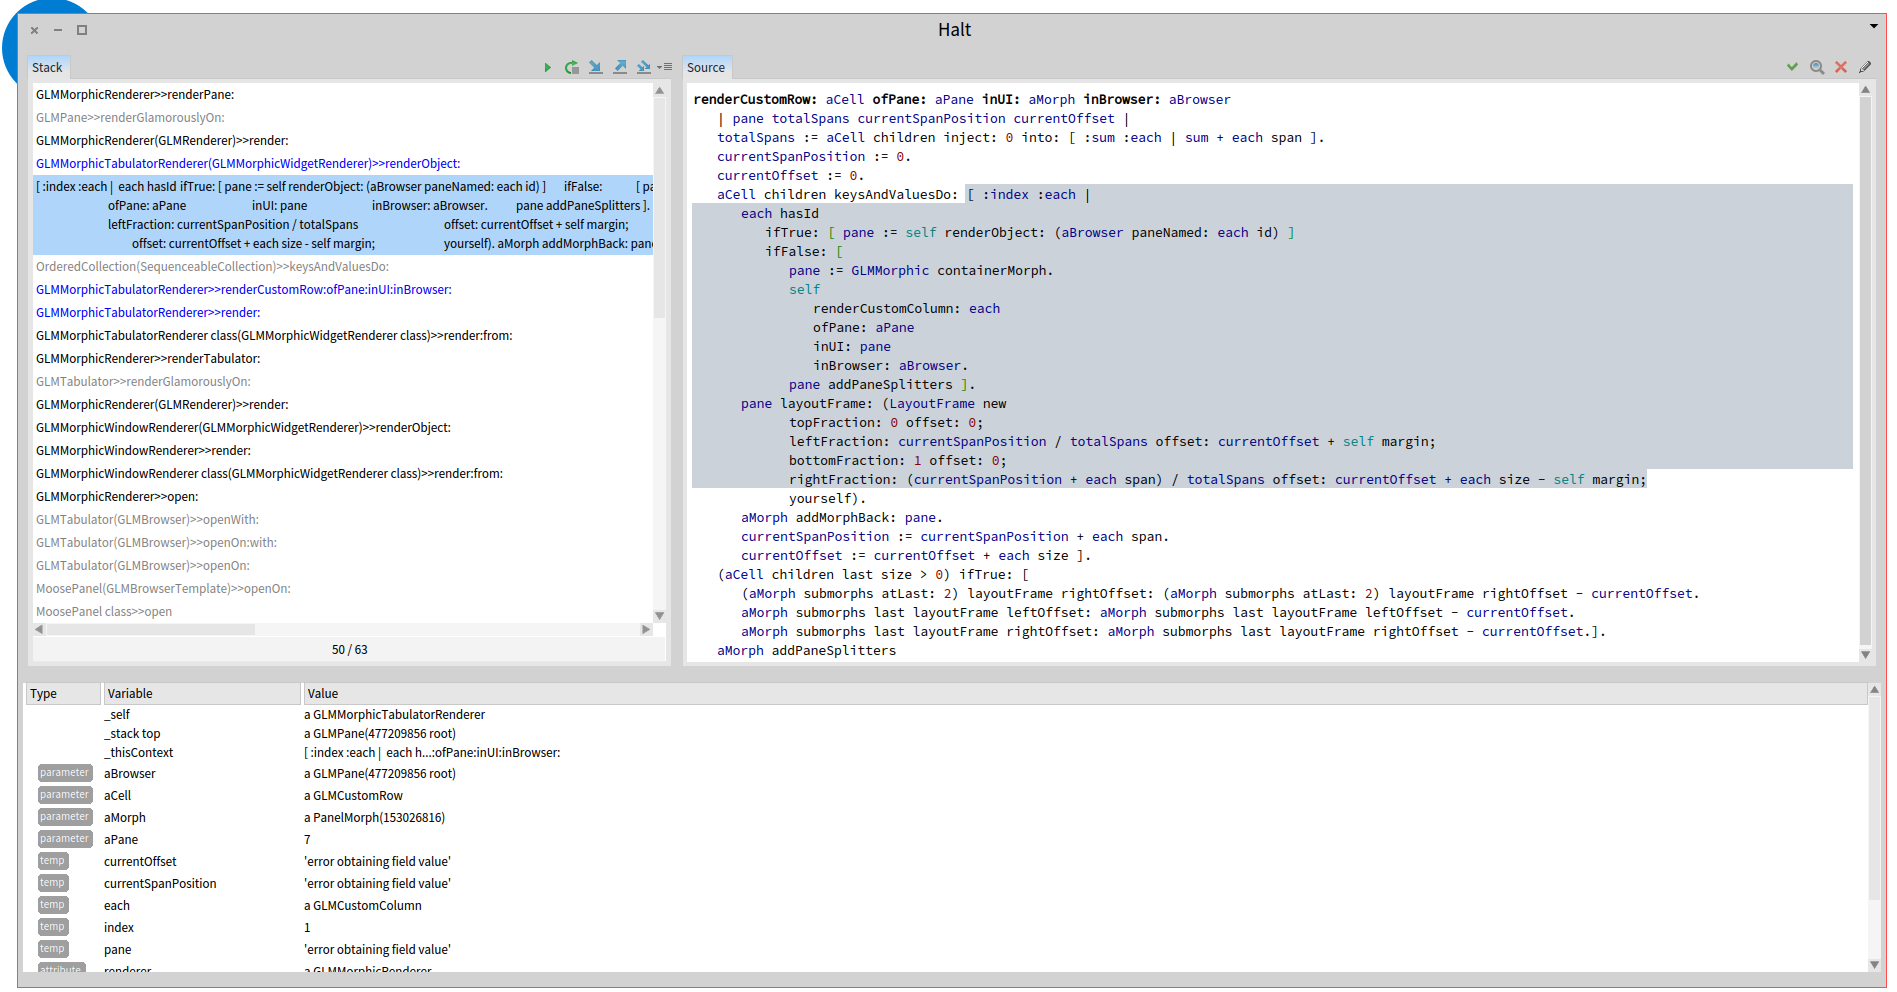
Hi, Thanks for the detailed feedback. See my comments inline.
On Jan 10, 2016, at 12:12 AM, Ferlicot D. Cyril <cyril.ferlicot@gmail.com> wrote:
Le 09/01/2016 10:32, Tudor Girba a écrit :
Hi,
Could you be specific? What exactly do you find less intuitive? To be able to react, it is useful to get concrete points.
Cheers, Doru
-- www.tudorgirba.com www.feenk.com
"Value is always contextual."
This was my impression but I will try to list these things.
First I find the improvements of Esteban good.
- For the icons it is true that the text help a lot. As someone mention, just a setting to get or not the text is possible, but a least be able to get the text is important IMO. I use Intellij for java debugging and sometime I get a little lost when I see the icons because for a same icon there is two different actions between Pharo and Intellij. So I lose always some time waiting the popup. And I think that a lot of students that do Java will have the same problem.
Interesting point, but I would not guide myself
- I like that the stack is fully loaded in the Spec debugger. In general that doesn't add this much time to show all the stack and it's one more line to show useful information.
It is now fully loaded in a FastTable in the GTDebugger as well.
- On thing that I really don't like is to get 4 lines with the code of a block in the stack. This is too much space I think. And because of this we have a large horizontal scroll bar that we could avoid with a limite in character. I miss the fact that we had the name of the class on the line of a block in the Spec debugger.
This is no longer the case in the latest implementation. Could you check?
For example I will join a screen with a block.
I would prefer something like:
In GLMMorphicTabulatorRenderer: [ :index :each | each hasId ifTrue:⦠] And if you use FTTable you will not even get the horizontal scrollbar, so it's useless to get 4 long lines of the block if we cannot see half of it.
Indeed. Printing is a problem of the Context printing, and will be changed, but in the meantime we have FastTable. Is this good enough for now?
- There is no way to close the inspector if we miss click
Indeed, this is a problem. We did not want to have an extra tab line and that is why we do not have a way to close inspector panes, but you can still scroll back. Also, in the meantime, we made the Evaluator the default second pane, so you can use it by default just like in the classic debugger.
- I liked the separation between attributes and parameter/temp. I think that it was more readable. Before I could had a global overview of both easily. Now I have to scroll down to see the attributes. But for this one maybe I prefer the old one by habits.
I think this is indeed a habit issue.
- The context menu of the spec debugger have more useful options (Suggestions, Code searchâ¦)
These can be added. Could you say more concretely which of those you actually used?
These are the things that come in my mind. But maybe I missed some since the fact that I found the old debugger more intuitive was a feeling. It's hard to define why we have a feeling.
Thanks for taking the time. I know itâs hard to dig underneath an impression like that, but it is very valuable once you do it because it can push us further. Cheers, Doru
-- Cyril Ferlicot
165 Avenue Bretagne Lille 59000 France <screen14.png>
-- www.tudorgirba.com www.feenk.com "Quality cannot be an afterthought."
2016-01-10 6:26 GMT+01:00 Tudor Girba <tudor@tudorgirba.com>:
Hi,
Thanks for the detailed feedback. See my comments inline.
On Jan 10, 2016, at 12:12 AM, Ferlicot D. Cyril < cyril.ferlicot@gmail.com> wrote:
Le 09/01/2016 10:32, Tudor Girba a écrit :
Hi,
Could you be specific? What exactly do you find less intuitive? To be able to react, it is useful to get concrete points.
Cheers, Doru
-- www.tudorgirba.com www.feenk.com
"Value is always contextual."
This was my impression but I will try to list these things.
First I find the improvements of Esteban good.
- For the icons it is true that the text help a lot. As someone mention, just a setting to get or not the text is possible, but a least be able to get the text is important IMO. I use Intellij for java debugging and sometime I get a little lost when I see the icons because for a same icon there is two different actions between Pharo and Intellij. So I lose always some time waiting the popup. And I think that a lot of students that do Java will have the same problem.
Interesting point, but I would not guide myself
- I like that the stack is fully loaded in the Spec debugger. In general that doesn't add this much time to show all the stack and it's one more line to show useful information.
It is now fully loaded in a FastTable in the GTDebugger as well.
- On thing that I really don't like is to get 4 lines with the code of a block in the stack. This is too much space I think. And because of this we have a large horizontal scroll bar that we could avoid with a limite in character. I miss the fact that we had the name of the class on the line of a block in the Spec debugger.
This is no longer the case in the latest implementation. Could you check?
For example I will join a screen with a block.
I would prefer something like:
In GLMMorphicTabulatorRenderer: [ :index :each | each hasId ifTrue:⦠] And if you use FTTable you will not even get the horizontal scrollbar, so it's useless to get 4 long lines of the block if we cannot see half of it.
Indeed. Printing is a problem of the Context printing, and will be changed, but in the meantime we have FastTable. Is this good enough for now?
- There is no way to close the inspector if we miss click
Indeed, this is a problem. We did not want to have an extra tab line and that is why we do not have a way to close inspector panes, but you can still scroll back. Also, in the meantime, we made the Evaluator the default second pane, so you can use it by default just like in the classic debugger.
How about making the first pane sticky? I ofte miss click, or if I want to open the context menu on a instance variable, or array item, for opening another inspector window, the contenxt inspect pane slides away and this is really annoying.
- I liked the separation between attributes and parameter/temp. I think that it was more readable. Before I could had a global overview of both easily. Now I have to scroll down to see the attributes. But for this one maybe I prefer the old one by habits.
I think this is indeed a habit issue.
- The context menu of the spec debugger have more useful options (Suggestions, Code searchâ¦)
These can be added. Could you say more concretely which of those you actually used?
These are the things that come in my mind. But maybe I missed some since the fact that I found the old debugger more intuitive was a feeling. It's hard to define why we have a feeling.
Thanks for taking the time. I know itâs hard to dig underneath an impression like that, but it is very valuable once you do it because it can push us further.
Cheers, Doru
-- Cyril Ferlicot
165 Avenue Bretagne Lille 59000 France <screen14.png>
-- www.tudorgirba.com www.feenk.com
"Quality cannot be an afterthought."

On 10-01-16 06:26, Tudor Girba wrote:
- There is no way to close the inspector if we miss click
Indeed, this is a problem. We did not want to have an extra tab line and that is why we do not have a way to close inspector panes, but you can still scroll back. Also, in the meantime, we made the Evaluator the default second pane, so you can use it by default just like in the classic debugger.
I would add a context menu on the GLMPagerScrollButtonBrick with close last and close all invisible and on each pane too I tried adding right click handling by adding the event to the GLMPagerButtonAnnouncement, setting it in GLMPagerScrollButtonBrick>>click and doing GLMPagerButtonsPaneBrick>>onButtonClicked: ann |event| event := ann event. event yellowButtonPressed ifTrue: [ self pagerModel popPane: true ] ifFalse: [ self pagerModel switchPaneTo: ann buttonModel index] but the right click doesn't arrive, possibly because the GLMPagerScrollSlidingBrick is intercepting it? Stephan
On Sun, Jan 10, 2016 at 12:54 PM, Stephan Eggermont <stephan@stack.nl> wrote:
On 10-01-16 06:26, Tudor Girba wrote:
- There is no way to close the inspector if we miss click
Indeed, this is a problem. We did not want to have an
extra tab line and that is why we do not have a way to
close inspector panes, but you can still scroll back. Also, in the meantime, we made the Evaluator the default
second pane, so you can use it by default just like in
the classic debugger.
I would add a context menu on the GLMPagerScrollButtonBrick with close last and close all invisible and on each pane too
I tried adding right click handling by adding the event to the GLMPagerButtonAnnouncement, setting it in GLMPagerScrollButtonBrick>>click and doing GLMPagerButtonsPaneBrick>>onButtonClicked: ann |event| event := ann event. event yellowButtonPressed ifTrue: [ self pagerModel popPane: true ] ifFalse: [ self pagerModel switchPaneTo: ann buttonModel index]
but the right click doesn't arrive, possibly because the GLMPagerScrollSlidingBrick is intercepting it?
Independent of your question now I added the close action in the toolbar of the presentation. Also to save space the navigation scrollbar only appears if you have more than three objects. Cheers, Andrei
Stephan
Le 09/01/2016 10:32, Tudor Girba a écrit :
Hi,
Could you be specific? What exactly do you find less intuitive? To be able to react, it is useful to get concrete points.
Cheers, Doru
-- www.tudorgirba.com www.feenk.com
"Value is always contextual."
Hi, After more reflection I find another thing that was, for me, better in the SpecDebugger. The fact that the methods and the classes was in two columns in the stack made the debugger clearer. Most of the time we know the methods and we do not need to check the name of the class. It was easier to check it with the two columns. And more, it make the debugger "ventilated" (I don't know if the term work in English too). I mean that with more space between the classes and the methods it's better for the eye of the user. -- Cyril Ferlicot http://www.synectique.eu 165 Avenue Bretagne Lille 59000 France
On Sun, Jan 17, 2016 at 9:48 AM, Cyril Ferlicot D. <cyril.ferlicot@gmail.com> wrote:
And more, it make the debugger "ventilated" (I don't know if the term work in English too). I mean that with more space between the classes and the methods it's better for the eye of the user.
Never heard the term used that way in graphic design, but it makes perfect sense. cheers -ben
Hi, Indeed. See below how it looks like in the latest development version. We have not yet integrate this one because we still need little changes in FastTable to be able to resize columns and not make the column names clickable. Cheers, Doru
On Jan 17, 2016, at 8:07 AM, Ben Coman <btc@openInWorld.com> wrote:
On Sun, Jan 17, 2016 at 9:48 AM, Cyril Ferlicot D. <cyril.ferlicot@gmail.com> wrote:
And more, it make the debugger "ventilated" (I don't know if the term work in English too). I mean that with more space between the classes and the methods it's better for the eye of the user.
Never heard the term used that way in graphic design, but it makes perfect sense. cheers -ben
-- www.tudorgirba.com www.feenk.com "If you can't say why something is relevant, it probably isn't."
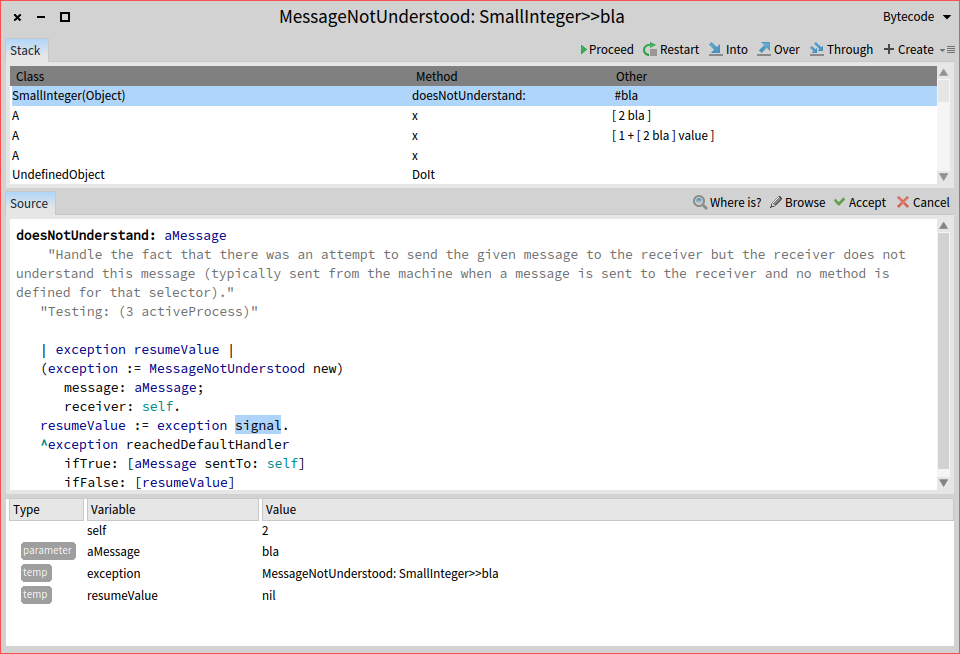
Please publish this change fast because after all the coding videos of the mooc will be impacted. Le 17/1/16 09:05, Tudor Girba a écrit :
Hi,
Indeed. See below how it looks like in the latest development version.
We have not yet integrate this one because we still need little changes in FastTable to be able to resize columns and not make the column names clickable.
Cheers, Doru
On Jan 17, 2016, at 8:07 AM, Ben Coman <btc@openInWorld.com <mailto:btc@openInWorld.com>> wrote:
On Sun, Jan 17, 2016 at 9:48 AM, Cyril Ferlicot D. <cyril.ferlicot@gmail.com <mailto:cyril.ferlicot@gmail.com>> wrote:
And more, it make the debugger "ventilated" (I don't know if the term work in English too). I mean that with more space between the classes and the methods it's better for the eye of the user.
Never heard the term used that way in graphic design, but it makes perfect sense. cheers -ben
-- www.tudorgirba.com <http://www.tudorgirba.com> www.feenk.com
"If you can't say why something is relevant, it probably isn't."
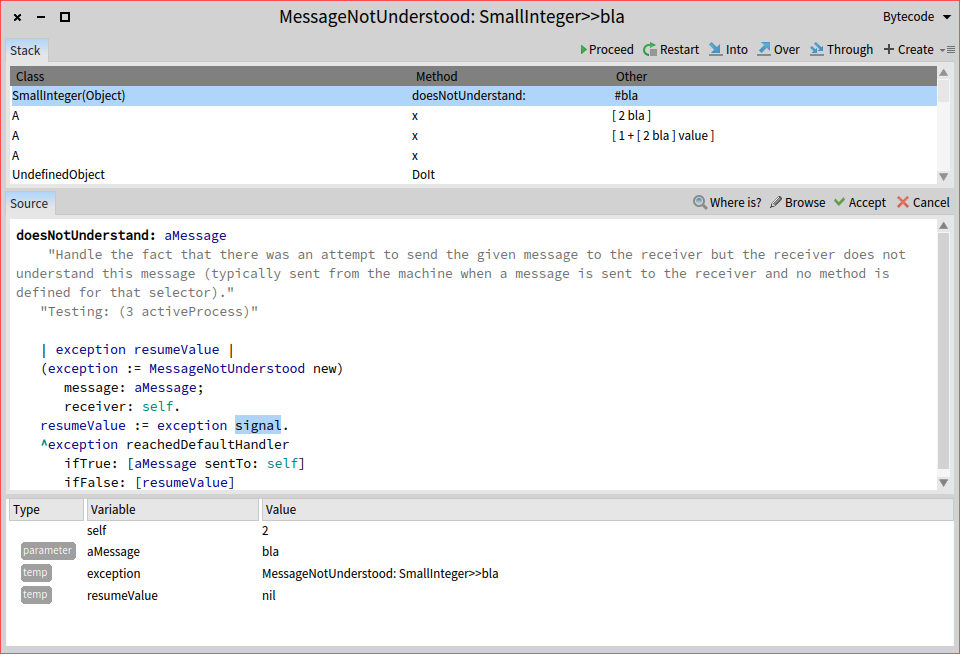
Hi, Indeed, this is the goal. What is the deadline until when we could still do something visual with the debugger? Cheers, Doru
On Jan 17, 2016, at 9:55 AM, stepharo <stepharo@free.fr> wrote:
Please publish this change fast because after all the coding videos of the mooc will be impacted.
Le 17/1/16 09:05, Tudor Girba a écrit :
Hi,
Indeed. See below how it looks like in the latest development version.
We have not yet integrate this one because we still need little changes in FastTable to be able to resize columns and not make the column names clickable.
<Mail Attachment.png>
Cheers, Doru
On Jan 17, 2016, at 8:07 AM, Ben Coman <btc@openInWorld.com> wrote:
On Sun, Jan 17, 2016 at 9:48 AM, Cyril Ferlicot D. <cyril.ferlicot@gmail.com> wrote:
And more, it make the debugger "ventilated" (I don't know if the term work in English too). I mean that with more space between the classes and the methods it's better for the eye of the user.
Never heard the term used that way in graphic design, but it makes perfect sense. cheers -ben
-- www.tudorgirba.com www.feenk.com
"If you can't say why something is relevant, it probably isn't."
-- www.tudorgirba.com www.feenk.com "Next time you see your life passing by, say 'hi' and get to know her."
End of this week else I will just do it and people will adapt.
Hi,
Indeed, this is the goal. What is the deadline until when we could still do something visual with the debugger?
Cheers, Doru
On Jan 17, 2016, at 9:55 AM, stepharo <stepharo@free.fr> wrote:
Please publish this change fast because after all the coding videos of the mooc will be impacted.
Le 17/1/16 09:05, Tudor Girba a écrit :
Hi,
Indeed. See below how it looks like in the latest development version.
We have not yet integrate this one because we still need little changes in FastTable to be able to resize columns and not make the column names clickable.
<Mail Attachment.png>
Cheers, Doru
On Jan 17, 2016, at 8:07 AM, Ben Coman <btc@openInWorld.com> wrote:
On Sun, Jan 17, 2016 at 9:48 AM, Cyril Ferlicot D. <cyril.ferlicot@gmail.com> wrote:
And more, it make the debugger "ventilated" (I don't know if the term work in English too). I mean that with more space between the classes and the methods it's better for the eye of the user. Never heard the term used that way in graphic design, but it makes perfect sense. cheers -ben
-- www.tudorgirba.com www.feenk.com
"If you can't say why something is relevant, it probably isn't."
-- www.tudorgirba.com www.feenk.com
"Next time you see your life passing by, say 'hi' and get to know her."
Great. That should be enough time to do a couple of iterations. Doru
On Jan 17, 2016, at 6:30 PM, stepharo <stepharo@free.fr> wrote:
End of this week else I will just do it and people will adapt.
Hi,
Indeed, this is the goal. What is the deadline until when we could still do something visual with the debugger?
Cheers, Doru
On Jan 17, 2016, at 9:55 AM, stepharo <stepharo@free.fr> wrote:
Please publish this change fast because after all the coding videos of the mooc will be impacted.
Le 17/1/16 09:05, Tudor Girba a écrit :
Hi,
Indeed. See below how it looks like in the latest development version.
We have not yet integrate this one because we still need little changes in FastTable to be able to resize columns and not make the column names clickable.
<Mail Attachment.png>
Cheers, Doru
On Jan 17, 2016, at 8:07 AM, Ben Coman <btc@openInWorld.com> wrote:
On Sun, Jan 17, 2016 at 9:48 AM, Cyril Ferlicot D. <cyril.ferlicot@gmail.com> wrote:
And more, it make the debugger "ventilated" (I don't know if the term work in English too). I mean that with more space between the classes and the methods it's better for the eye of the user. Never heard the term used that way in graphic design, but it makes perfect sense. cheers -ben
-- www.tudorgirba.com www.feenk.com
"If you can't say why something is relevant, it probably isn't."
-- www.tudorgirba.com www.feenk.com
"Next time you see your life passing by, say 'hi' and get to know her."
-- www.tudorgirba.com www.feenk.com "Being happy is a matter of choice."
I'm going over the pdf descriptions of the lecture and after I will follow the pdfs and record. Stef Le 17/1/16 18:32, Tudor Girba a écrit :
Great. That should be enough time to do a couple of iterations.
Doru
On Jan 17, 2016, at 6:30 PM, stepharo <stepharo@free.fr> wrote:
End of this week else I will just do it and people will adapt.
Hi,
Indeed, this is the goal. What is the deadline until when we could still do something visual with the debugger?
Cheers, Doru
On Jan 17, 2016, at 9:55 AM, stepharo <stepharo@free.fr> wrote:
Please publish this change fast because after all the coding videos of the mooc will be impacted.
Le 17/1/16 09:05, Tudor Girba a écrit :
Hi,
Indeed. See below how it looks like in the latest development version.
We have not yet integrate this one because we still need little changes in FastTable to be able to resize columns and not make the column names clickable.
<Mail Attachment.png>
Cheers, Doru
On Jan 17, 2016, at 8:07 AM, Ben Coman <btc@openInWorld.com> wrote:
On Sun, Jan 17, 2016 at 9:48 AM, Cyril Ferlicot D. <cyril.ferlicot@gmail.com> wrote:
And more, it make the debugger "ventilated" (I don't know if the term work in English too). I mean that with more space between the classes and the methods it's better for the eye of the user. Never heard the term used that way in graphic design, but it makes perfect sense. cheers -ben
-- www.tudorgirba.com www.feenk.com
"If you can't say why something is relevant, it probably isn't."
-- www.tudorgirba.com www.feenk.com
"Next time you see your life passing by, say 'hi' and get to know her."
-- www.tudorgirba.com www.feenk.com
"Being happy is a matter of choice."

Cool. While you are there, could provide a way to separate instance variables from local variables (and class shared variables too, maybe)? It could be different columns, filtering, tabs, I do not really care. Currently, when debugging classes with lots of instance variables (like morphic stuff) it's quite painful to find the one local variable of interest. Also, could the scroll position in the variable be preserved while stepping? And could the shortcuts for stepping through code NOT conflict with any shortcut in the source code editor? Or failing that, could there be a simple, discoverable, reliable shortcut to put the focus on the call stack? Unfortunately, Pharo does not appear to receive ctrl-tab keydown events, so I need to reach for the mouse to move the focus out of any text area... Sent from my phone. Envoyé avec mon téléphone.
Le 17 janv. 2016 à 09:05, Tudor Girba <tudor@tudorgirba.com> a écrit :
Hi,
Indeed. See below how it looks like in the latest development version.
We have not yet integrate this one because we still need little changes in FastTable to be able to resize columns and not make the column names clickable.
<table-stack-details.png>
Cheers, Doru
On Jan 17, 2016, at 8:07 AM, Ben Coman <btc@openInWorld.com> wrote:
On Sun, Jan 17, 2016 at 9:48 AM, Cyril Ferlicot D. <cyril.ferlicot@gmail.com> wrote:
And more, it make the debugger "ventilated" (I don't know if the term work in English too). I mean that with more space between the classes and the methods it's better for the eye of the user.
Never heard the term used that way in graphic design, but it makes perfect sense. cheers -ben
-- www.tudorgirba.com www.feenk.com
"If you can't say why something is relevant, it probably isn't."
Hi,
On Jan 17, 2016, at 1:18 PM, David Allouche <david@allouche.net> wrote:
Cool. While you are there, could provide a way to separate instance variables from local variables (and class shared variables too, maybe)? It could be different columns, filtering, tabs, I do not really care. Currently, when debugging classes with lots of instance variables (like morphic stuff) it's quite painful to find the one local variable of interest.
The tags to the left of each variable can be used to filter the list of variables.
Also, could the scroll position in the variable be preserved while stepping?
I am not sure what you refer to. The currently selected variable is preserved both when you step, and it is even preserved when you switch back and forth through the stack. What am I missing?
And could the shortcuts for stepping through code NOT conflict with any shortcut in the source code editor? Or failing that, could there be a simple, discoverable, reliable shortcut to put the focus on the call stack?
Thanks for pointing it out. I added a test for this, and we identified two keybindings with double meaning: - Cmd+p - Cmd+t I added a test for this and an issue: https://pharo.fogbugz.com/f/cases/17408/The-generic-stack-debugger-defines-d... In the process, I also noticed that Smart Suggestions have the keybinding defined as $t meta instead of 4t command. I added an issue for this and as well: https://pharo.fogbugz.com/f/cases/17407/Smart-suggestions-shortcut-should-us...
Unfortunately, Pharo does not appear to receive ctrl-tab keydown events, so I need to reach for the mouse to move the focus out of any text areaâ¦
Indeed, this does not work. Cheers, Doru
Sent from my phone.
Envoyé avec mon téléphone. Le 17 janv. 2016 à 09:05, Tudor Girba <tudor@tudorgirba.com> a écrit :
Hi,
Indeed. See below how it looks like in the latest development version.
We have not yet integrate this one because we still need little changes in FastTable to be able to resize columns and not make the column names clickable.
<table-stack-details.png>
Cheers, Doru
On Jan 17, 2016, at 8:07 AM, Ben Coman <btc@openInWorld.com> wrote:
On Sun, Jan 17, 2016 at 9:48 AM, Cyril Ferlicot D. <cyril.ferlicot@gmail.com> wrote:
And more, it make the debugger "ventilated" (I don't know if the term work in English too). I mean that with more space between the classes and the methods it's better for the eye of the user.
Never heard the term used that way in graphic design, but it makes perfect sense. cheers -ben
-- www.tudorgirba.com www.feenk.com
"If you can't say why something is relevant, it probably isn't."
-- www.tudorgirba.com www.feenk.com "Innovation comes in the least expected form. That is, if it is expected, it already happened."
On 17 Jan 2016, at 16:52, Tudor Girba <tudor@tudorgirba.com> wrote:
Hi,
On Jan 17, 2016, at 1:18 PM, David Allouche <david@allouche.net> wrote:
Cool. While you are there, could provide a way to separate instance variables from local variables (and class shared variables too, maybe)? It could be different columns, filtering, tabs, I do not really care. Currently, when debugging classes with lots of instance variables (like morphic stuff) it's quite painful to find the one local variable of interest.
The tags to the left of each variable can be used to filter the list of variables.
Nice, but: It's not an obvious, standard UI behaviour In a complex class, you still need to hunt through the list to find the first local variable, that's frustrating. You cannot even use incremental search there. That should probably be a wishlist item on the bug tracker.
Also, could the scroll position in the variable be preserved while stepping?
I am not sure what you refer to. The currently selected variable is preserved both when you step, and it is even preserved when you switch back and forth through the stack.
What am I missing?
The selected variable is preserved, but if ones scroll the variable list using the mouse wheel, the scroll position changes but not the selection. Stepping resets the scroll position to show the selected variable, which is "self" by default. I would like the scroll position for the variable list to be remembered by the debugger in each object. Or maybe the right granularity is concrete class, I am not sure.
Unfortunately, Pharo does not appear to receive ctrl-tab keydown events, so I need to reach for the mouse to move the focus out of any text areaâ¦
Indeed, this does not work.
I already reported that before on the mailing list, and I have tracked it down to ctrl-tab keydown not even reaching Sensor. The corresponding keyup are correctly detected. So I guess it might be a vm issue. I should probably file a proper bug report.

On Jan 17, 2016, at 12:05 AM, Tudor Girba <tudor@tudorgirba.com> wrote:
Hi,
Indeed. See below how it looks like in the latest development version.
We have not yet integrate this one because we still need little changes in FastTable to be able to resize columns and not make the column names clickable.
I have to say that the column names are entirely redundant. They're obvious from the information presented (unless empty when no stack frame is selected). They eat vertical screen real estate and are one more set of strings to localize. Nuke em. _,,,^..^,,,_ (phone)
<table-stack-details.png>
Cheers, Doru
On Jan 17, 2016, at 8:07 AM, Ben Coman <btc@openInWorld.com> wrote:
On Sun, Jan 17, 2016 at 9:48 AM, Cyril Ferlicot D. <cyril.ferlicot@gmail.com> wrote:
And more, it make the debugger "ventilated" (I don't know if the term work in English too). I mean that with more space between the classes and the methods it's better for the eye of the user.
Never heard the term used that way in graphic design, but it makes perfect sense. cheers -ben
-- www.tudorgirba.com www.feenk.com
"If you can't say why something is relevant, it probably isn't."
Hi,
On Jan 17, 2016, at 3:51 PM, Eliot Miranda <eliot.miranda@gmail.com> wrote:
On Jan 17, 2016, at 12:05 AM, Tudor Girba <tudor@tudorgirba.com> wrote:
Hi,
Indeed. See below how it looks like in the latest development version.
We have not yet integrate this one because we still need little changes in FastTable to be able to resize columns and not make the column names clickable.
I have to say that the column names are entirely redundant. They're obvious from the information presented (unless empty when no stack frame is selected). They eat vertical screen real estate and are one more set of strings to localize. Nuke em.
We are looking at that option as well. However, we still need a way to resize the columns, especially when we have large class or method names. We need to play a bit here. Cheers, Doru
_,,,^..^,,,_ (phone)
<table-stack-details.png>
Cheers, Doru
On Jan 17, 2016, at 8:07 AM, Ben Coman <btc@openInWorld.com> wrote:
On Sun, Jan 17, 2016 at 9:48 AM, Cyril Ferlicot D. <cyril.ferlicot@gmail.com> wrote:
And more, it make the debugger "ventilated" (I don't know if the term work in English too). I mean that with more space between the classes and the methods it's better for the eye of the user.
Never heard the term used that way in graphic design, but it makes perfect sense. cheers -ben
-- www.tudorgirba.com www.feenk.com
"If you can't say why something is relevant, it probably isn't."
-- www.tudorgirba.com www.feenk.com "Be rather willing to give than demanding to get."
Le 17/01/2016 15:51, Eliot Miranda a écrit :
I have to say that the column names are entirely redundant. They're obvious from the information presented (unless empty when no stack frame is selected). They eat vertical screen real estate and are one more set of strings to localize. Nuke em.
_,,,^..^,,,_ (phone)
+ 1 -- Cyril Ferlicot http://www.synectique.eu 165 Avenue Bretagne Lille 59000 France

2016-01-17 11:51 GMT-03:00 Eliot Miranda <eliot.miranda@gmail.com>:
On Jan 17, 2016, at 12:05 AM, Tudor Girba <tudor@tudorgirba.com> wrote:
Hi,
Indeed. See below how it looks like in the latest development version.
We have not yet integrate this one because we still need little changes in FastTable to be able to resize columns and not make the column names clickable.
I have to say that the column names are entirely redundant. They're obvious from the information presented (unless empty when no stack frame is selected). They eat vertical screen real estate and are one more set of strings to localize. Nuke em.
+1 I prefer the old stack printout. Regards, -- Esteban.
On Mon, Jan 18, 2016 at 9:45 PM, Esteban A. Maringolo <emaringolo@gmail.com> wrote:
2016-01-17 11:51 GMT-03:00 Eliot Miranda <eliot.miranda@gmail.com>:
On Jan 17, 2016, at 12:05 AM, Tudor Girba <tudor@tudorgirba.com> wrote:
Hi,
Indeed. See below how it looks like in the latest development version.
We have not yet integrate this one because we still need little changes in FastTable to be able to resize columns and not make the column names clickable.
I have to say that the column names are entirely redundant. They're obvious from the information presented (unless empty when no stack frame is selected). They eat vertical screen real estate and are one more set of strings to localize. Nuke em.
+1
I prefer the old stack printout.
Just a random thought and I've no idea if it would work in practice or get in the way or is worth the effort... the column names could drop down when you hover near the top edge of the pane. Its something that may be useful to a newcomer only for a short while. cheers -ben
there has been around a script to automate the screenshots, but personally I never bother using it because taking a screenshot and inserting in pillar is the easiest thing.On macos is just CMD+SHIFT+4 and you just choose the area you want to screenshot and thats it, it takes a second. Documentation itself is the hard part. Plus I can help with the screenshots , its not big deal. I even have access to the github repo of Mooc but I just try to focus on UPBE. My connection is down at the moment, but when it will be up again, I will be able to help. On Sat, Jan 9, 2016 at 1:33 PM Stephan Eggermont <stephan@stack.nl> wrote:
On 08-01-16 21:22, stepharo wrote:
- It looks a lot more complex to me and I do not want to have to redo all the screenshots of our lecture.
What do you need to automate the screenshots?
Stephan
On 09-01-16 12:39, Dimitris Chloupis wrote:
there has been around a script to automate the screenshots, but personally I never bother using it because taking a screenshot and inserting in pillar is the easiest thing.
AFAIK the hard part is keeping things up to date. That's where automation helps. Stephan

http://ws.stfx.eu/3KXXDAJ4EUF6 -----Original Message----- From: Pharo-dev [mailto:pharo-dev-bounces@lists.pharo.org] On Behalf Of Stephan Eggermont Sent: Saturday, January 9, 2016 3:36 PM To: pharo-dev@lists.pharo.org Subject: Re: [Pharo-dev] gtdebugger in pharo 5.0 On 09-01-16 12:39, Dimitris Chloupis wrote:
there has been around a script to automate the screenshots, but personally I never bother using it because taking a screenshot and inserting in pillar is the easiest thing.
AFAIK the hard part is keeping things up to date. That's where automation helps. Stephan

Hi, i would like to have the GTDebugger in the near future. Great job and thanks! I like the Esteban built instead of the original one and i agree with stef on removing _stack and _thisContext from top and the bytecode view. Aim to simplicity must be a top priority and if anybody needs something more specific can change it easily (its moldable!) Cheers Francisco On Sat, Jan 9, 2016 at 12:07 PM, Henrik Nergaard <henrik.nergaard@uia.no> wrote:
http://ws.stfx.eu/3KXXDAJ4EUF6
-----Original Message----- From: Pharo-dev [mailto:pharo-dev-bounces@lists.pharo.org] On Behalf Of Stephan Eggermont Sent: Saturday, January 9, 2016 3:36 PM To: pharo-dev@lists.pharo.org Subject: Re: [Pharo-dev] gtdebugger in pharo 5.0
On 09-01-16 12:39, Dimitris Chloupis wrote:
there has been around a script to automate the screenshots, but personally I never bother using it because taking a screenshot and inserting in pillar is the easiest thing.
AFAIK the hard part is keeping things up to date. That's where automation helps.
Stephan
2016-01-09 20:52 GMT+01:00 Francisco Ortiz Peñaloza <patchinko@gmail.com>:
Hi,
i would like to have the GTDebugger in the near future. Great job and thanks!
I like the Esteban built instead of the original one and i agree with stef on removing _stack and _thisContext from top and the bytecode view. Aim to simplicity must be a top priority and if anybody needs something more specific can change it easily (its moldable!)
I often use thisContext and stackTop for inspecting the current context (I use this a lot when debugging compiler errors) and the stackTop when stepping through cascaded message send, I want to see the intermediate return value.
Cheers Francisco
On Sat, Jan 9, 2016 at 12:07 PM, Henrik Nergaard <henrik.nergaard@uia.no> wrote:
http://ws.stfx.eu/3KXXDAJ4EUF6
-----Original Message----- From: Pharo-dev [mailto:pharo-dev-bounces@lists.pharo.org] On Behalf Of Stephan Eggermont Sent: Saturday, January 9, 2016 3:36 PM To: pharo-dev@lists.pharo.org Subject: Re: [Pharo-dev] gtdebugger in pharo 5.0
On 09-01-16 12:39, Dimitris Chloupis wrote:
there has been around a script to automate the screenshots, but personally I never bother using it because taking a screenshot and inserting in pillar is the easiest thing.
AFAIK the hard part is keeping things up to date. That's where automation helps.
Stephan
Hi,
On Jan 9, 2016, at 10:23 PM, Nicolai Hess <nicolaihess@gmail.com> wrote:
2016-01-09 20:52 GMT+01:00 Francisco Ortiz Peñaloza <patchinko@gmail.com>: Hi,
i would like to have the GTDebugger in the near future. Great job and thanks!
I like the Esteban built instead of the original one and i agree with stef on removing _stack and _thisContext from top and the bytecode view. Aim to simplicity must be a top priority and if anybody needs something more specific can change it easily (its moldable!)
I often use thisContext and stackTop for inspecting the current context (I use this a lot when debugging compiler errors) and the stackTop when stepping through cascaded message send, I want to see the intermediate return value.
Indeed, I use them too, but not too often. That is why Andrei and I think maybe they should be in the menu of hte stack and have them appear in the inspector below. What do you think? Cheers, Doru
Cheers Francisco
On Sat, Jan 9, 2016 at 12:07 PM, Henrik Nergaard <henrik.nergaard@uia.no> wrote: http://ws.stfx.eu/3KXXDAJ4EUF6
-----Original Message----- From: Pharo-dev [mailto:pharo-dev-bounces@lists.pharo.org] On Behalf Of Stephan Eggermont Sent: Saturday, January 9, 2016 3:36 PM To: pharo-dev@lists.pharo.org Subject: Re: [Pharo-dev] gtdebugger in pharo 5.0
On 09-01-16 12:39, Dimitris Chloupis wrote:
there has been around a script to automate the screenshots, but personally I never bother using it because taking a screenshot and inserting in pillar is the easiest thing.
AFAIK the hard part is keeping things up to date. That's where automation helps.
Stephan
-- www.tudorgirba.com www.feenk.com "Every thing has its own flow."
2016-01-09 22:51 GMT+01:00 Tudor Girba <tudor@tudorgirba.com>:
Hi,
On Jan 9, 2016, at 10:23 PM, Nicolai Hess <nicolaihess@gmail.com> wrote:
2016-01-09 20:52 GMT+01:00 Francisco Ortiz Peñaloza <patchinko@gmail.com : Hi,
i would like to have the GTDebugger in the near future. Great job and thanks!
I like the Esteban built instead of the original one and i agree with stef on removing _stack and _thisContext from top and the bytecode view. Aim to simplicity must be a top priority and if anybody needs something more specific can change it easily (its moldable!)
I often use thisContext and stackTop for inspecting the current context (I use this a lot when debugging compiler errors) and the stackTop when stepping through cascaded message send, I want to see the intermediate return value.
Indeed, I use them too, but not too often. That is why Andrei and I think maybe they should be in the menu of hte stack and have them appear in the inspector below. What do you think?
I don't know. At the moment I would say, keep it. It is a valuable information about the current state of the execution. But if you implement it as you described, I will test and give feedback. I would not change the name of thisContext to _thisContext. The name "thisContext" is a valid and evaluatable variable name. It is confusing if we show it as "_thisContext" just to tell it appart from "normal" variable names. There is a "type" column, this could be used to name this kind of variable ("pseudo Var" for example).
Cheers, Doru
Cheers Francisco
On Sat, Jan 9, 2016 at 12:07 PM, Henrik Nergaard <henrik.nergaard@uia.no>
wrote:
http://ws.stfx.eu/3KXXDAJ4EUF6
-----Original Message----- From: Pharo-dev [mailto:pharo-dev-bounces@lists.pharo.org] On Behalf Of Stephan Eggermont Sent: Saturday, January 9, 2016 3:36 PM To: pharo-dev@lists.pharo.org Subject: Re: [Pharo-dev] gtdebugger in pharo 5.0
On 09-01-16 12:39, Dimitris Chloupis wrote:
there has been around a script to automate the screenshots, but personally I never bother using it because taking a screenshot and inserting in pillar is the easiest thing.
AFAIK the hard part is keeping things up to date. That's where automation helps.
Stephan
-- www.tudorgirba.com www.feenk.com
"Every thing has its own flow."
You should do a video because I do not even understand how to use it. So how a newbie can understand? Stef Le 9/1/16 21:23, Nicolai Hess a écrit :
2016-01-09 20:52 GMT+01:00 Francisco Ortiz Peñaloza <patchinko@gmail.com <mailto:patchinko@gmail.com>>:
Hi,
i would like to have the GTDebugger in the near future. Great job and thanks!
I like the Esteban built instead of the original one and i agree with stef on removing _stack and _thisContext from top and the bytecode view. Aim to simplicity must be a top priority and if anybody needs something more specific can change it easily (its moldable!)
I often use thisContext and stackTop for inspecting the current context (I use this a lot when debugging compiler errors) and the stackTop when stepping through cascaded message send, I want to see the intermediate return value.
Cheers Francisco
On Sat, Jan 9, 2016 at 12:07 PM, Henrik Nergaard <henrik.nergaard@uia.no <mailto:henrik.nergaard@uia.no>> wrote:
http://ws.stfx.eu/3KXXDAJ4EUF6
-----Original Message----- From: Pharo-dev [mailto:pharo-dev-bounces@lists.pharo.org <mailto:pharo-dev-bounces@lists.pharo.org>] On Behalf Of Stephan Eggermont Sent: Saturday, January 9, 2016 3:36 PM To: pharo-dev@lists.pharo.org <mailto:pharo-dev@lists.pharo.org> Subject: Re: [Pharo-dev] gtdebugger in pharo 5.0
On 09-01-16 12:39, Dimitris Chloupis wrote: > there has been around a script to automate the screenshots, but > personally I never bother using it because taking a screenshot and > inserting in pillar is the easiest thing.
AFAIK the hard part is keeping things up to date. That's where automation helps.
Stephan
Hi,
On Jan 9, 2016, at 9:52 PM, Francisco Ortiz Peñaloza <patchinko@gmail.com> wrote:
Hi,
i would like to have the GTDebugger in the near future. Great job and thanks!
I like the Esteban built instead of the original one and i agree with stef on removing _stack and _thisContext from top and the bytecode view. Aim to simplicity must be a top priority and if anybody needs something more specific can change it easily (its moldable!)
:) Doru
Cheers Francisco
On Sat, Jan 9, 2016 at 12:07 PM, Henrik Nergaard <henrik.nergaard@uia.no> wrote: http://ws.stfx.eu/3KXXDAJ4EUF6
-----Original Message----- From: Pharo-dev [mailto:pharo-dev-bounces@lists.pharo.org] On Behalf Of Stephan Eggermont Sent: Saturday, January 9, 2016 3:36 PM To: pharo-dev@lists.pharo.org Subject: Re: [Pharo-dev] gtdebugger in pharo 5.0
On 09-01-16 12:39, Dimitris Chloupis wrote:
there has been around a script to automate the screenshots, but personally I never bother using it because taking a screenshot and inserting in pillar is the easiest thing.
AFAIK the hard part is keeping things up to date. That's where automation helps.
Stephan
-- www.tudorgirba.com www.feenk.com "Quality cannot be an afterthought."
Hello everyone, As expected, there was some feedback. Here is a summary: 1. The layout should mirror the classic debugger - The previous layout was chosen to show more of the stack and to make use of the screen real estate. - But, as that is not an essential component of GTDebugger, the current implementation of the generic stack debugger looks like this now: 2. it would be interesting if the buttons would have text - This is something we need to work on 3. Why is there bytecode shown? - There is none by default :). This only appears when the developer explicitly chooses the Bytecode debugger 4. why is there a _thisContext _stackTop? - Because this is what the SpecDebugger offers as well :). - But, we removed them for now from the list. - There would be a possibility to add them to the context menu of the stack or to add them to bottom of the list 5. why is there a Type column in the inspector - Because we want to know what kind of variable we are dealing with (parameter, instvar, temp). This is not explicit in other debuggers. - Furthermore, you can filter the variables by clicking on the type tag. This can be particularly useful when we deal with large states. Please let me know if I missed anything. Of these only point 2 requires work. Cheers, Doru
On Jan 8, 2016, at 1:07 PM, Tudor Girba <tudor@tudorgirba.com> wrote:
Hi,
We are about to integrate in Pharo a new member of the Glamorous Toolkit: the GTDebugger. As this is a significant change that might affect your workflow, here is some background information to help you deal with the change.
First, you should know that the change is not irreversible and it is easily possible to disabled the new debugger through a setting. However, please do take the time to provide us feedback if something does not work out for you. We want to know what can be improved and we try to react as fast as we can.
A practical change comes from the fact that the variables are manipulated through a GTInspector, which makes it cheaper to maintain in the longer run.
While the first thing that will capture the attention is the default generic interface, the real power comes from the moldable nature of the debugger. Like all other GT tools, GTDebugger is also moldable by design. This means that we can construct custom debuggers for specific libraries at small costs (often measured in a couple of hundred lines of code).
For example, the core configuration includes also the SUnit and the bytecode debugger. These are around 150 lines of code. Here is how the bytecode debugger looks like:
<bytecode.png>
You can find more information in an introductory overview blog post that also includes some links for further reading: http://www.humane-assessment.com/blog/gtdebugger-in-pharo/
Please let us know what you think.
Cheers, Doru
-- www.tudorgirba.com www.feenk.com
"What is more important: To be happy, or to make happy?"
-- www.tudorgirba.com www.feenk.com "It's not how it is, it is how we see it."
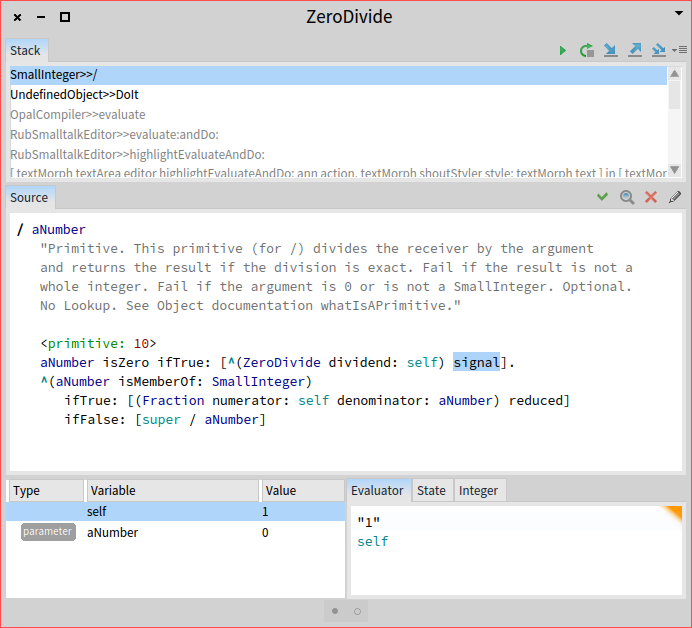
- Can we have a setting to remove all the colors from the stack because sometimes the hilighting is more confusing than helping and especially for newbies - the argument about run to here not being a button is not about logical placement is it about making things easy to use and discover. - I found the icon on the right (the right mo When do you think that the new debugger could be stable. Because we can try to see if we can change the lectures and change the screenshots but first we should finish the other ones. Stef Le 9/1/16 22:35, Tudor Girba a écrit :
Hello everyone,
As expected, there was some feedback. Here is a summary:
1. The layout should mirror the classic debugger - The previous layout was chosen to show more of the stack and to make use of the screen real estate. - But, as that is not an essential component of GTDebugger, the current implementation of the generic stack debugger looks like this now:
2. it would be interesting if the buttons would have text - This is something we need to work on
3. Why is there bytecode shown? - There is none by default :). This only appears when the developer explicitly chooses the Bytecode debugger
4. why is there a _thisContext _stackTop? - Because this is what the SpecDebugger offers as well :). - But, we removed them for now from the list. - There would be a possibility to add them to the context menu of the stack or to add them to bottom of the list
5. why is there a Type column in the inspector - Because we want to know what kind of variable we are dealing with (parameter, instvar, temp). This is not explicit in other debuggers. - Furthermore, you can filter the variables by clicking on the type tag. This can be particularly useful when we deal with large states.
Please let me know if I missed anything. Of these only point 2 requires work.
Cheers, Doru
On Jan 8, 2016, at 1:07 PM, Tudor Girba <tudor@tudorgirba.com <mailto:tudor@tudorgirba.com>> wrote:
Hi,
We are about to integrate in Pharo a new member of the Glamorous Toolkit: the GTDebugger. As this is a significant change that might affect your workflow, here is some background information to help you deal with the change.
First, you should know that the change is not irreversible and it is easily possible to disabled the new debugger through a setting. However, please do take the time to provide us feedback if something does not work out for you. We want to know what can be improved and we try to react as fast as we can.
A practical change comes from the fact that the variables are manipulated through a GTInspector, which makes it cheaper to maintain in the longer run.
While the first thing that will capture the attention is the default generic interface, the real power comes from the moldable nature of the debugger. Like all other GT tools, GTDebugger is also moldable by design. This means that we can construct custom debuggers for specific libraries at small costs (often measured in a couple of hundred lines of code).
For example, the core configuration includes also the SUnit and the bytecode debugger. These are around 150 lines of code. Here is how the bytecode debugger looks like:
<bytecode.png>
You can find more information in an introductory overview blog post that also includes some links for further reading: http://www.humane-assessment.com/blog/gtdebugger-in-pharo/
Please let us know what you think.
Cheers, Doru
-- www.tudorgirba.com www.feenk.com
"What is more important: To be happy, or to make happy?"
-- www.tudorgirba.com <http://www.tudorgirba.com> www.feenk.com
"It's not how it is, it is how we see it."
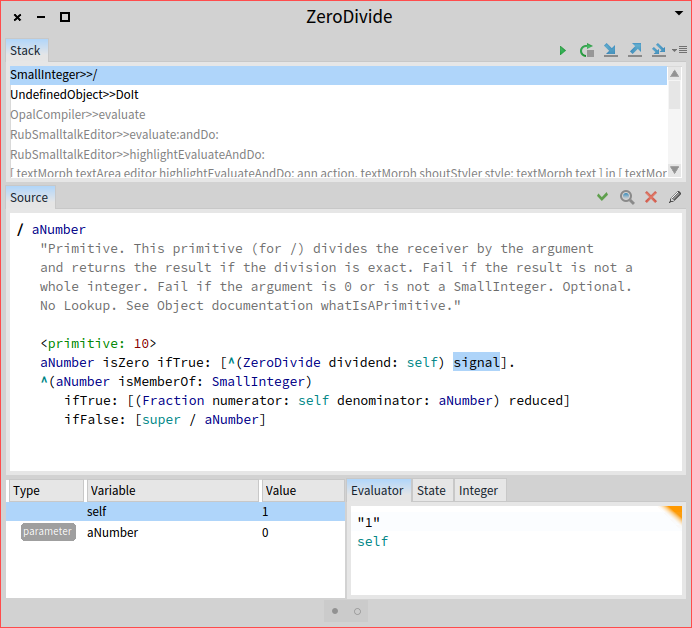
On Sun, Jan 10, 2016 at 5:51 AM, stepharo <stepharo@free.fr> wrote:
- Can we have a setting to remove all the colors from the stack because sometimes the hilighting is more confusing than helping and especially for newbies
There is a setting for this which allows you to disable it. Maybe we should disable it by default (thought I would enable it for myself)
- the argument about run to here not being a button is not about logical placement is it about making things easy to use and discover.
- I found the icon on the right (the right mo
When do you think that the new debugger could be stable. Because we can try to see if we can change the lectures and change the screenshots but first we should finish the other ones.
Stef
Le 9/1/16 22:35, Tudor Girba a écrit :
Hello everyone,
As expected, there was some feedback. Here is a summary:
1. The layout should mirror the classic debugger - The previous layout was chosen to show more of the stack and to make use of the screen real estate. - But, as that is not an essential component of GTDebugger, the current implementation of the generic stack debugger looks like this now:
2. it would be interesting if the buttons would have text - This is something we need to work on
3. Why is there bytecode shown? - There is none by default :). This only appears when the developer explicitly chooses the Bytecode debugger
4. why is there a _thisContext _stackTop? - Because this is what the SpecDebugger offers as well :). - But, we removed them for now from the list. - There would be a possibility to add them to the context menu of the stack or to add them to bottom of the list
5. why is there a Type column in the inspector - Because we want to know what kind of variable we are dealing with (parameter, instvar, temp). This is not explicit in other debuggers. - Furthermore, you can filter the variables by clicking on the type tag. This can be particularly useful when we deal with large states.
Please let me know if I missed anything. Of these only point 2 requires work.
Cheers, Doru
On Jan 8, 2016, at 1:07 PM, Tudor Girba <tudor@tudorgirba.com> wrote:
Hi,
We are about to integrate in Pharo a new member of the Glamorous Toolkit: the GTDebugger. As this is a significant change that might affect your workflow, here is some background information to help you deal with the change.
First, you should know that the change is not irreversible and it is easily possible to disabled the new debugger through a setting. However, please do take the time to provide us feedback if something does not work out for you. We want to know what can be improved and we try to react as fast as we can.
A practical change comes from the fact that the variables are manipulated through a GTInspector, which makes it cheaper to maintain in the longer run.
While the first thing that will capture the attention is the default generic interface, the real power comes from the moldable nature of the debugger. Like all other GT tools, GTDebugger is also moldable by design. This means that we can construct custom debuggers for specific libraries at small costs (often measured in a couple of hundred lines of code).
For example, the core configuration includes also the SUnit and the bytecode debugger. These are around 150 lines of code. Here is how the bytecode debugger looks like:
<bytecode.png>
You can find more information in an introductory overview blog post that also includes some links for further reading: http://www.humane-assessment.com/blog/gtdebugger-in-pharo/
Please let us know what you think.
Cheers, Doru
-- www.tudorgirba.com www.feenk.com
"What is more important: To be happy, or to make happy?"
-- www.tudorgirba.com www.feenk.com
"It's not how it is, it is how we see it."
-- Mariano http://marianopeck.wordpress.com
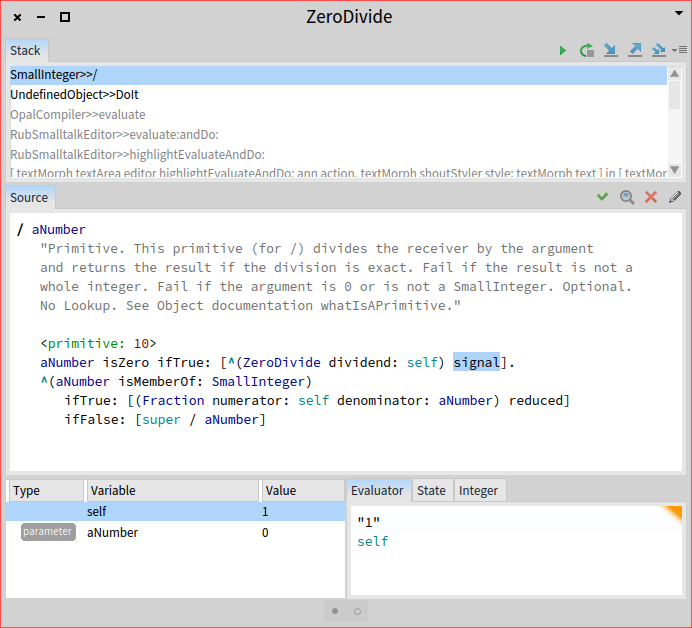
Hi,
On Jan 10, 2016, at 10:51 AM, stepharo <stepharo@free.fr> wrote:
- Can we have a setting to remove all the colors from the stack because sometimes the hilighting is more confusing than helping and especially for newbies
As Mariano said, there is one already.
- the argument about run to here not being a button is not about logical placement is it about making things easy to use and discover.
Please, letâs be reasonable. This is a contextual action, and it is not at all unreasonable to have it as a contextual menu.
- I found the icon on the right (the right mo
You did not finish this one.
When do you think that the new debugger could be stable.
What is needed from your point of view except from the labels on the buttons?
Because we can try to see if we can change the lectures and change the screenshots but first we should finish the other ones.
Thank you for wanting to find a solution. Cheers, Doru
Stef
Le 9/1/16 22:35, Tudor Girba a écrit :
Hello everyone,
As expected, there was some feedback. Here is a summary:
1. The layout should mirror the classic debugger - The previous layout was chosen to show more of the stack and to make use of the screen real estate. - But, as that is not an essential component of GTDebugger, the current implementation of the generic stack debugger looks like this now:
<Mail Attachment.png>
2. it would be interesting if the buttons would have text - This is something we need to work on
3. Why is there bytecode shown? - There is none by default :). This only appears when the developer explicitly chooses the Bytecode debugger
4. why is there a _thisContext _stackTop? - Because this is what the SpecDebugger offers as well :). - But, we removed them for now from the list. - There would be a possibility to add them to the context menu of the stack or to add them to bottom of the list
5. why is there a Type column in the inspector - Because we want to know what kind of variable we are dealing with (parameter, instvar, temp). This is not explicit in other debuggers. - Furthermore, you can filter the variables by clicking on the type tag. This can be particularly useful when we deal with large states.
Please let me know if I missed anything. Of these only point 2 requires work.
Cheers, Doru
On Jan 8, 2016, at 1:07 PM, Tudor Girba <tudor@tudorgirba.com> wrote:
Hi,
We are about to integrate in Pharo a new member of the Glamorous Toolkit: the GTDebugger. As this is a significant change that might affect your workflow, here is some background information to help you deal with the change.
First, you should know that the change is not irreversible and it is easily possible to disabled the new debugger through a setting. However, please do take the time to provide us feedback if something does not work out for you. We want to know what can be improved and we try to react as fast as we can.
A practical change comes from the fact that the variables are manipulated through a GTInspector, which makes it cheaper to maintain in the longer run.
While the first thing that will capture the attention is the default generic interface, the real power comes from the moldable nature of the debugger. Like all other GT tools, GTDebugger is also moldable by design. This means that we can construct custom debuggers for specific libraries at small costs (often measured in a couple of hundred lines of code).
For example, the core configuration includes also the SUnit and the bytecode debugger. These are around 150 lines of code. Here is how the bytecode debugger looks like:
<bytecode.png>
You can find more information in an introductory overview blog post that also includes some links for further reading: http://www.humane-assessment.com/blog/gtdebugger-in-pharo/
Please let us know what you think.
Cheers, Doru
-- www.tudorgirba.com www.feenk.com
"What is more important: To be happy, or to make happy?"
-- www.tudorgirba.com www.feenk.com
"It's not how it is, it is how we see it."
-- www.tudorgirba.com www.feenk.com "We are all great at making mistakes."
participants (19)
-
 Alexandre Bergel
 -
 Andrei Chis
 -
 Ben Coman
 -
 Christophe Demarey
 -
 Cyril Ferlicot D.
 -
 David Allouche
 -
 Dimitris Chloupis
 -
 Eliot Miranda
 -
 Esteban A. Maringolo
 -
 Esteban Lorenzano
 -
Ferlicot D. Cyril
-
 Francisco Ortiz Peñaloza
 -
 Henrik Nergaard
 -
 Mariano Martinez Peck
 -
 Nicolai Hess
 -
 Stephan Eggermont
 -
 stepharo
 -
 Sven Van Caekenberghe
 -
 Tudor Girba