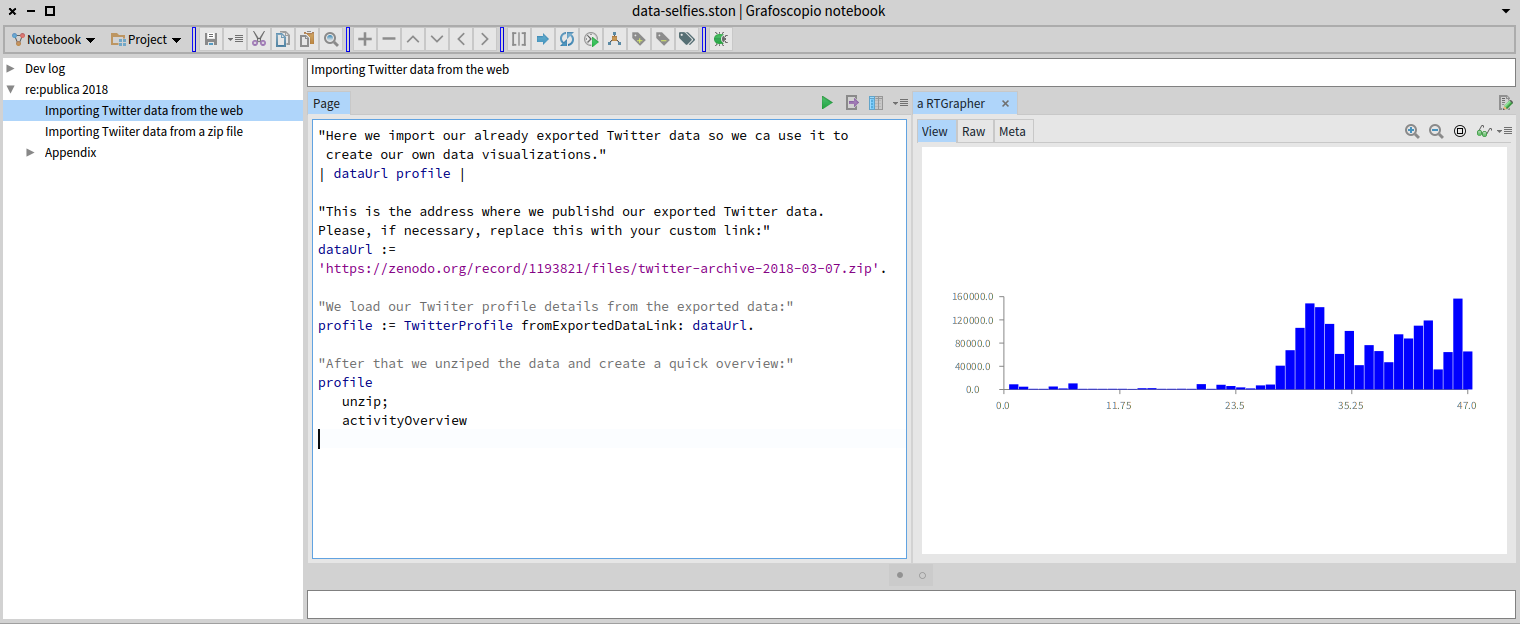
Hi, I'm making a histogram of files that have the naming convention |YYYY_MM.js|, for year and month info. The image below shows what I get until now: By the way, you can run this example by loading and updating the Dataviz package [2] from [3] [2] http://mutabit.com/repos.fossil/grafoscopio/doc/tip/Packages/Dataviz/readme.... [3] http://ws.stfx.eu/OUEYE943HV3Q I would like to have bars for every year of a file name in a different color (I imagine that using |#distinctColorUsing:| ) and ticks on each year. I'm seeing some examples in the image and in http://agilevisualization.com/AgileVisualization/Roassal/0104-Roassal.html, but I wonder if there is a more mature and already existing RTObject for this kind of work. Also I would like to show Y axis scale using size of files in a human friendly format (160 Kb instead of 160000.0 and so on). Any help or pointers on this is greatly appreciated. Cheers, Offray