Histogram for files dates and sizes

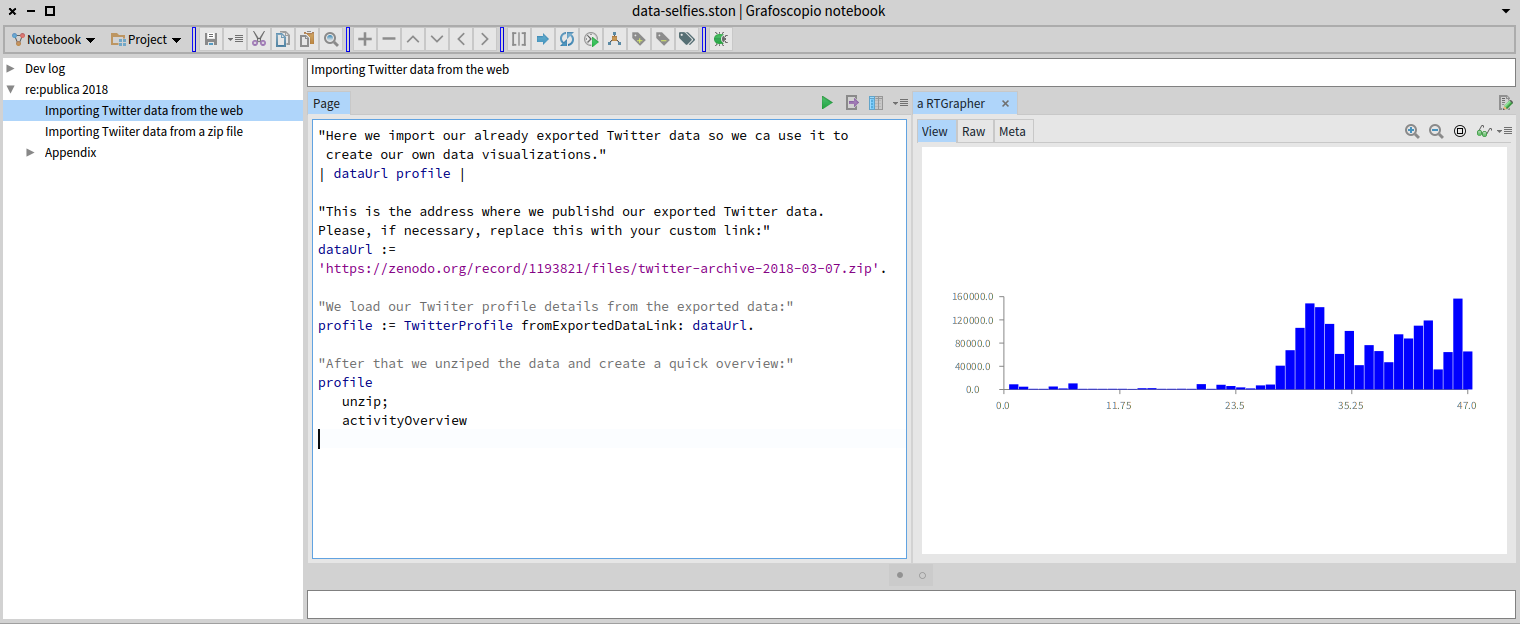
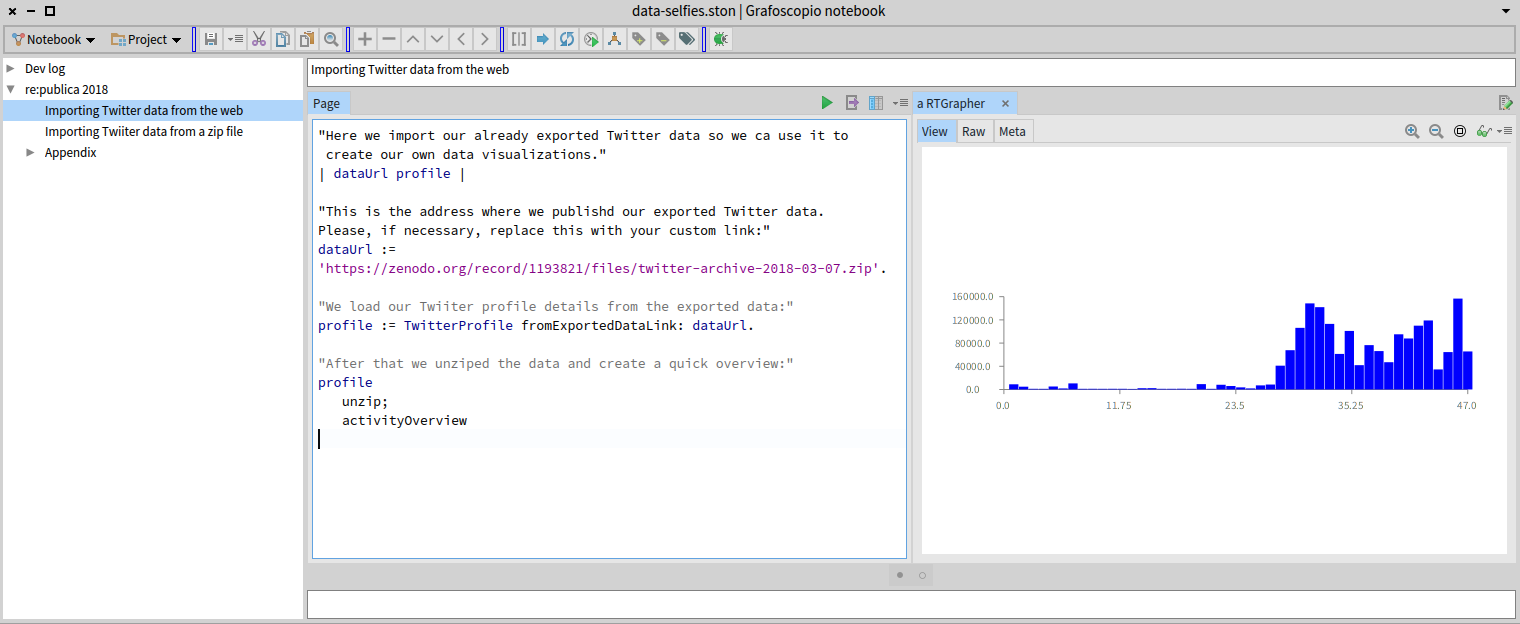
Hi, I'm making a histogram of files that have the naming convention |YYYY_MM.js|, for year and month info. The image below shows what I get until now: By the way, you can run this example by loading and updating the Dataviz package [2] from [3] [2] http://mutabit.com/repos.fossil/grafoscopio/doc/tip/Packages/Dataviz/readme.... [3] http://ws.stfx.eu/OUEYE943HV3Q I would like to have bars for every year of a file name in a different color (I imagine that using |#distinctColorUsing:| ) and ticks on each year. I'm seeing some examples in the image and in http://agilevisualization.com/AgileVisualization/Roassal/0104-Roassal.html, but I wonder if there is a more mature and already existing RTObject for this kind of work. Also I would like to show Y axis scale using size of files in a human friendly format (160 Kb instead of 160000.0 and so on). Any help or pointers on this is greatly appreciated. Cheers, Offray
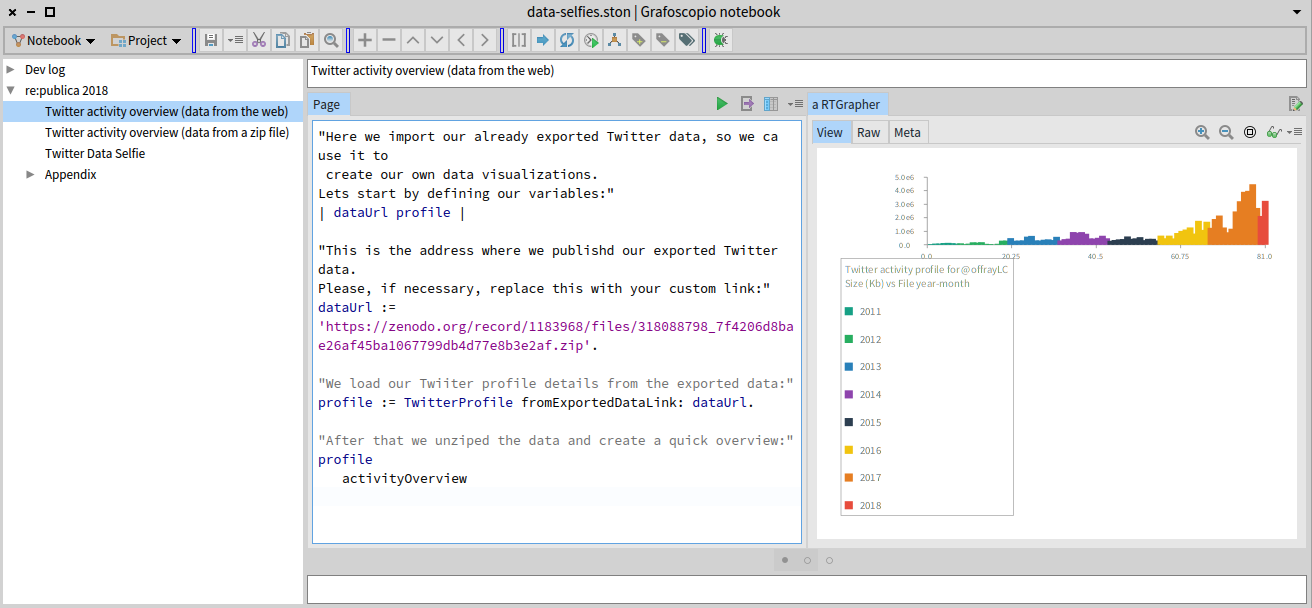
Hi, Here is the improved version: As you can see, now I coded colored years functionality (I thought that colored histograms, following a criteria, would be supported by default, but I was unable to find any documentation or example about it). Two questions remain: * How can I add ticks in the X axis, so they correspond to a particular criteria? For example, a change in the year? * There is any way to make the RTLegend puts the color labels in a "matrix alike" fashion? So, for example, I would like to say that instead of having the default 1xn column of color labels, as now, I want them organized over a nxm matrix, so they suit better different graphical objects and layouts. Thanks, Offray On 26/04/18 14:31, Offray Vladimir Luna Cárdenas wrote:
Hi,
I'm making a histogram of files that have the naming convention |YYYY_MM.js|, for year and month info. The image below shows what I get until now:
By the way, you can run this example by loading and updating the Dataviz package [2] from [3]
[2] http://mutabit.com/repos.fossil/grafoscopio/doc/tip/Packages/Dataviz/readme.... [3] http://ws.stfx.eu/OUEYE943HV3Q
I would like to have bars for every year of a file name in a different color (I imagine that using |#distinctColorUsing:| ) and ticks on each year. I'm seeing some examples in the image and in http://agilevisualization.com/AgileVisualization/Roassal/0104-Roassal.html, but I wonder if there is a more mature and already existing RTObject for this kind of work. Also I would like to show Y axis scale using size of files in a human friendly format (160 Kb instead of 160000.0 and so on).
Any help or pointers on this is greatly appreciated.
Cheers,
Offray

Hi Offray, You can add ticks as follows: -=-=-=-=-=-=-=-=-=-=-=-=-=-=-=-= c := (1 to: 100) collect: [ :i | 50 atRandom @ 50 atRandom ]. g := RTGrapher new. d := RTData new. d points: c. d x: #x. d y: #y. g add: d. g axisX noTick. g axisY noTick. g addDecorator: (RTVerticalValuesDecorator new addAll: #(10 25)). g addDecorator: (RTHorizontalValuesDecorator new addAll: #(10 25)). g -=-=-=-=-=-=-=-=-=-=-=-=-=-=-=-= For the legend, there is actually no such a support. However, it should be easy to add a new rule, as a subclass of RTLegendItem Cheers, Alexandre
On May 6, 2018, at 9:13 AM, Offray Vladimir Luna Cárdenas <offray.luna@mutabit.com> wrote:
Hi,
Here is the improved version:
<iiboahmkfajnlmam.png>
As you can see, now I coded colored years functionality (I thought that colored histograms, following a criteria, would be supported by default, but I was unable to find any documentation or example about it). Two questions remain:
⢠How can I add ticks in the X axis, so they correspond to a particular criteria? For example, a change in the year? ⢠There is any way to make the RTLegend puts the color labels in a "matrix alike" fashion? So, for example, I would like to say that instead of having the default 1xn column of color labels, as now, I want them organized over a nxm matrix, so they suit better different graphical objects and layouts. Thanks,
Offray
On 26/04/18 14:31, Offray Vladimir Luna Cárdenas wrote:
Hi,
I'm making a histogram of files that have the naming convention YYYY_MM.js, for year and month info. The image below shows what I get until now:
<pgoajgjcjaoiebgb.png>
By the way, you can run this example by loading and updating the Dataviz package [2] from [3]
[2] http://mutabit.com/repos.fossil/grafoscopio/doc/tip/Packages/Dataviz/readme.... [3] http://ws.stfx.eu/OUEYE943HV3Q I would like to have bars for every year of a file name in a different color (I imagine that using #distinctColorUsing: ) and ticks on each year. I'm seeing some examples in the image and in http://agilevisualization.com/AgileVisualization/Roassal/0104-Roassal.html, but I wonder if there is a more mature and already existing RTObject for this kind of work. Also I would like to show Y axis scale using size of files in a human friendly format (160 Kb instead of 160000.0 and so on).
Any help or pointers on this is greatly appreciated.
Cheers,
Offray
participants (2)
-
 Alexandre Bergel
 -
 Offray Vladimir Luna Cárdenas