Hi Alex, El vie., 12 oct. 2018 a las 19:37, Alexandre Bergel (< alexandre.bergel@me.com>) escribió:
Hi Hernán,
Sorry for the late reply.
No problem, my replay is even more delayed!
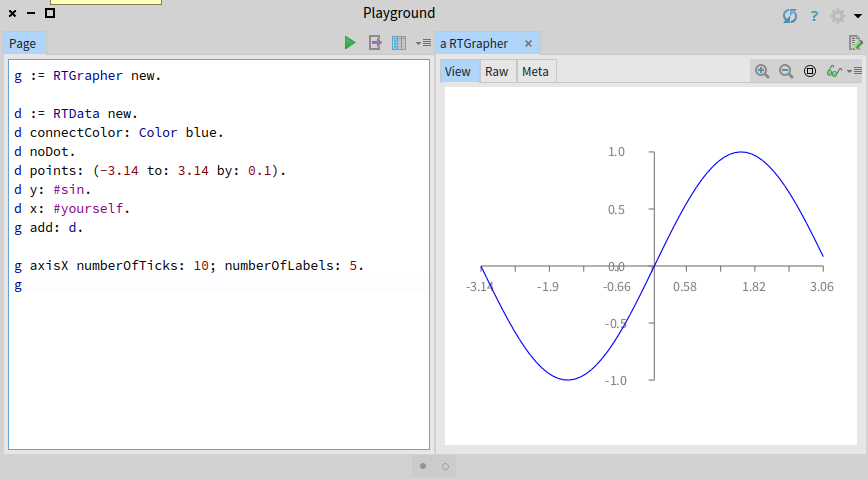
Regarding your first question, you can do: -=-=-=-=-=-= g := RTGrapher new.
d := RTData new. d connectColor: Color blue. d noDot. d points: (-3.14 to: 3.14 by: 0.1). d y: #sin. d x: #yourself. g add: d.
g axisX numberOfTicks: 10; numberOfLabels: 5. g -=-=-=-=-=-= As you can see, the line "g axisX numberOfTicks: 10; numberOfLabels: 5.â allows you to set the number of ticks and the number of labels.
Thanks, with you and Milton's help I could set up the labels as I needed.
Regarding your second question, where can I find the file OrderedCollection_3712516797.obj ?
I think the attachment was truncated in the moose-dev mailing list because I received: Message body is too big: 3346796 bytes with a limit of 1000 KB However it should be accessible through the pharo-users mailing list. Let me know if you cannot download it. Or, how can I reproduce it.
Anyway, I believe the problem is that you have too many points. In this case, I suggest you to reduce the number of points.
I was reading a bit on the subject of plotting billions of points, and it seems there are libraries which can do it: http://holoviews.org/user_guide/Large_Data.html This is based on a technique they call datashading. However since I don't know Roassal internals, I cannot tell what's the fundamental difference. Is it a big change to reproduce the datashading principles in Roassal?
For example, a slight variation of the previous example [DO NOT RUN IT]: -=-=-=-=-=-= points := -3.14 to: 3.14 by: 0.000001.
g := RTGrapher new.
d := RTData new. d connectColor: Color blue. d noDot. d points: points. d y: #sin. d x: #yourself. g add: d.
g axisX numberOfTicks: 10; numberOfLabels: 5. g -=-=-=-=-=-=
The script tries to build the same graph but with 6 280 001 points. Which obviously, is way too many.
Instead, you can do something like: -=-=-=-=-=-= points := SortedCollection new. 1000 timesRepeat: [ points add: (-3.14 to: 3.14 by: 0.000001) atRandom ].
g := RTGrapher new.
d := RTData new. d connectColor: Color blue. d noDot. d points: points. d y: #sin. d x: #yourself. g add: d.
g axisX numberOfTicks: 10; numberOfLabels: 5. g -=-=-=-=-=-=
Which only display the graph with 1000 points.
If I correctly understood the idea. I could reduce my collection of x values: #(15 15 15 15 15 15 15 15 20 20 20 20 32 32 32 45 45 45 45 45 45) having repetitions count of 8 4 3 6 respectively, and set a threshold, for example 4 to obtain: #(15 15 20 45) Is that correct? Cheers, Hernán Cheers,
Alexandre
On Oct 4, 2018, at 12:49 AM, Hernán Morales Durand < hernan.morales@gmail.com> wrote:
This is weird, could you check:
http://lists.pharo.org/pipermail/pharo-users_lists.pharo.org/2018-October/04...
Hernán
El mié., 3 oct. 2018 a las 22:41, Alexandre Bergel (<alexandre.bergel@me.com>) escribió:
I am lost. What are the questions? I do not see them in the mailing list.
Alexandre
On Oct 3, 2018, at 11:11 AM, Hernán Morales Durand < hernan.morales@gmail.com> wrote:
Hi Alex,
Thanks. Please note there are two questions related to Roassal :) I have isolated the script so you don't need to load BioSmalltalk
Maybe someone can check or give a hint?
El mar., 2 oct. 2018 a las 22:31, Alexandre Bergel (<alexandre.bergel@me.com>) escribió:
Pretty cool!
Alexandre
On Oct 2, 2018, at 2:21 AM, Hernán Morales Durand < hernan.morales@gmail.com> wrote:
<a TRMorph(28411392).png><skew_diagram_ecoli.png>
_______________________________________________ Moose-dev mailing list Moose-dev@list.inf.unibe.ch https://www.list.inf.unibe.ch/listinfo/moose-dev
_______________________________________________ Moose-dev mailing list Moose-dev@list.inf.unibe.ch https://www.list.inf.unibe.ch/listinfo/moose-dev
_______________________________________________ Moose-dev mailing list Moose-dev@list.inf.unibe.ch https://www.list.inf.unibe.ch/listinfo/moose-dev