Fwd: Plotting genome scale values with Roassal

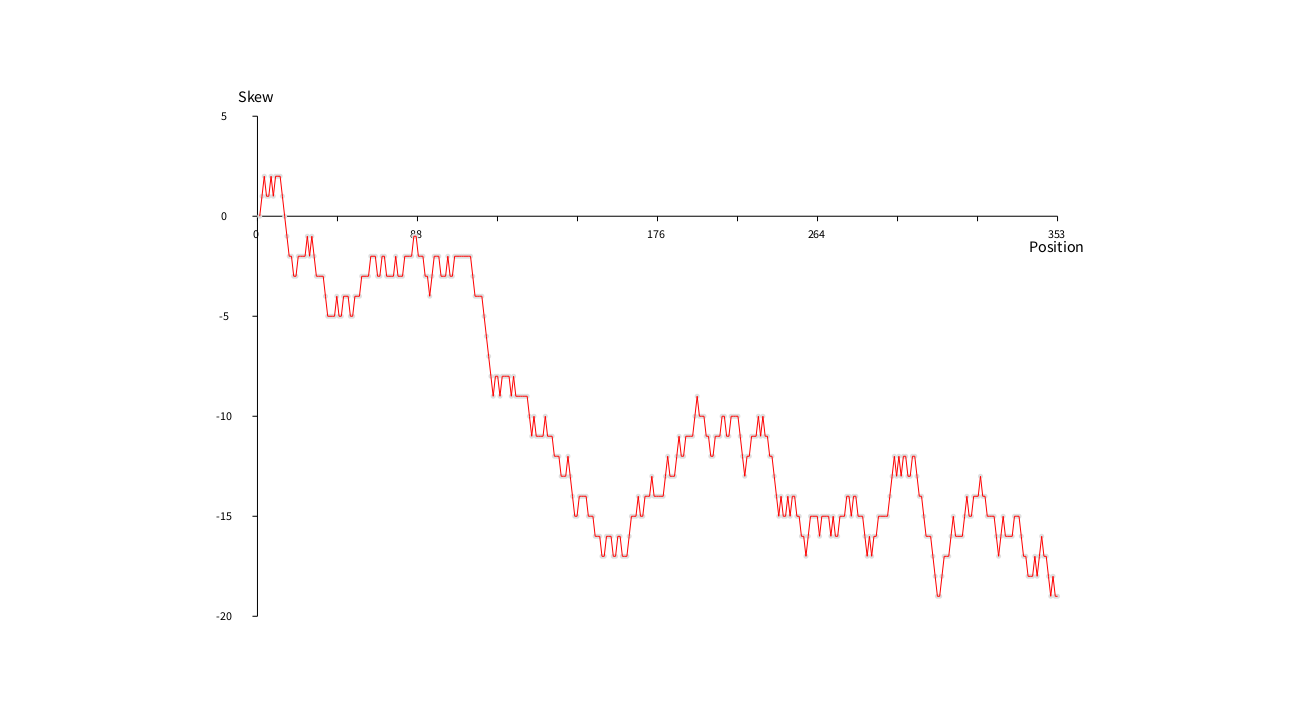
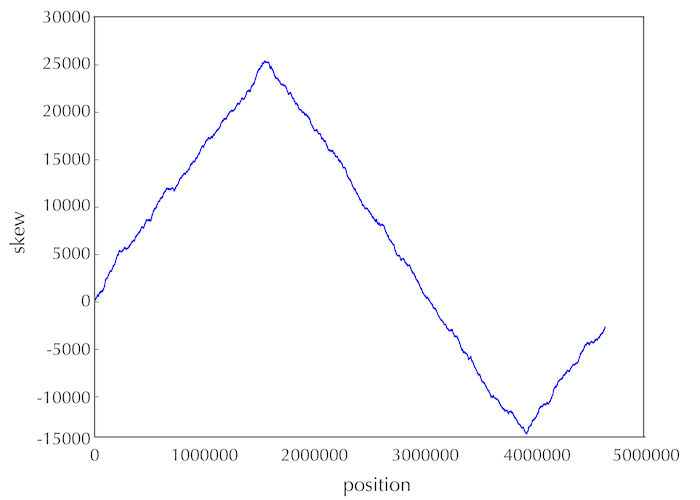
Hi, I have a couple of Roassal questions regarding how to customize the plots of a genome metric known as GC skew, and how to scale the visualization to cover a (bacterial) genome scale data. For a toy example, I have isolated a Roassal sample code below from BioSmalltalk to show how I did an initial GC skew graphic: | b values ds | values := 'GGCTGCGTTCCCCTCAGTTAGCGCCTATCCTAAGCAGATCTGTAGTTAGTACTGTCTAAGCTTGTTAGACTACTCGGAACTTGCTGATATTAACCTTACCCCCGTCGAAACGCTTATTCCGCTTTGCTACTTCAAGCCCTGTAACATCTACTGTACTGACAAGGTTGCAGTAGCAATTGGCAAGGCTGTTTGGCATCTCAGATGACAGTTACCCGTGTTGCGCTCACCCGCAGCGACTCTCGGATACGTAACGCAGAAGACGTCTTCCGCGAGATTTGGGCGCGTCTGTCCACCTTCCCAGGTTGGCATTGGCAGAAGCTCTATCCGGCTTTGTTCCTCTAGCGGCTCCGCA' asDNASimpleSequence gcSkewInt. values := #(0 1 2 1 1 2 1 2 2 2 1 0 -1 -2 -2 -3 -3 -2 -2 -2 -2 -1 -2 -1 -2 -3 -3 -3 -3 -4 -5 -5 -5 -5 -4 -5 -5 -4 -4 -4 -5 -5 -4 -4 -4 -3 -3 -3 -3 -2 -2 -2 -3 -3 -2 -2 -3 -3 -3 -3 -2 -3 -3 -3 -2 -2 -2 -2 -1 -1 -2 -2 -2 -3 -3 -4 -3 -2 -2 -2 -3 -3 -3 -2 -3 -3 -2 -2 -2 -2 -2 -2 -2 -2 -3 -4 -4 -4 -4 -5 -6 -7 -8 -9 -8 -8 -9 -8 -8 -8 -8 -9 -8 -9 -9 -9 -9 -9 -9 -10 -11 -10 -11 -11 -11 -11 -10 -11 -11 -11 -12 -12 -12 -13 -13 -13 -12 -13 -14 -15 -15 -14 -14 -14 -14 -15 -15 -15 -16 -16 -16 -17 -17 -16 -16 -16 -17 -17 -16 -16 -17 -17 -17 -16 -15 -15 -15 -14 -15 -15 -14 -14 -14 -13 -14 -14 -14 -14 -14 -13 -12 -13 -13 -13 -12 -11 -12 -12 -11 -11 -11 -11 -10 -9 -10 -10 -10 -11 -11 -12 -12 -11 -11 -11 -10 -10 -11 -11 -10 -10 -10 -10 -11 -12 -13 -12 -12 -11 -11 -11 -10 -11 -10 -11 -11 -12 -12 -13 -14 -15 -14 -15 -15 -14 -15 -14 -14 -15 -15 -16 -16 -17 -16 -15 -15 -15 -15 -16 -15 -15 -15 -15 -16 -15 -16 -16 -15 -15 -15 -14 -14 -15 -14 -14 -15 -15 -15 -16 -17 -16 -17 -16 -16 -15 -15 -15 -15 -15 -14 -13 -12 -13 -12 -13 -12 -12 -13 -13 -12 -12 -13 -14 -14 -15 -16 -16 -16 -17 -18 -19 -19 -18 -17 -17 -17 -16 -15 -16 -16 -16 -16 -15 -14 -15 -15 -14 -14 -14 -13 -14 -14 -15 -15 -15 -15 -16 -17 -16 -15 -16 -16 -16 -16 -15 -15 -15 -16 -17 -17 -18 -18 -18 -17 -18 -17 -16 -17 -17 -18 -19 -18 -19 -19). b := RTGrapher new. b extent: 800 @ 500. ds := RTData new noDot; points: values; connectColor: Color red; yourself. b add: ds. b axisY minValue: values min; title: 'Skew'; color: Color black; noDecimal. b axisX numberOfTicks: 10; noDecimal; color: Color black; title: 'Position'. b open 1) You can see the result in the TR Morph.png attached file. In X axis, how can set up a tick every certain step value? For example, every 50 points. Right now this is 88, 176, 264, 353 and I would like to be 50, 100, 150, 200, 250, 300, 350, 400. 2) I just plotted a very short toy DNA sequence, however if I would like to plot GC skew for E.coli that would take hundreds of points. The following script takes ages to complete or it never ends. You will find attached the necessary files: | grapher ds eColiGCSkew zipArchive | " The original dataset " "(ZnEasy get: 'http://bioinformaticsalgorithms.com/data/realdatasets/Replication/E_coli.txt') contents asDNASimpleSequence." "'/Users/mvs/Downloads/E_coli.txt' asFileReference size." "4639675" " GC Skew calc using BioSmalltalk " "eColiGCSkew := '/Users/mvs/Downloads/E_coli.txt' asFileReference contents asDNASimpleSequence gcSkewInt." " GC Skew already calculated in a FUEL compressed for this example, ecoligcskew.zip available at https://drive.google.com/file/d/1k9qayWrGkBEOeZ3Wb8TIJ80Rl-IR2Znx/view?usp=s... " zipArchive := ZipArchive new. [ zipArchive readFrom: 'ecoligcskew.zip' fullName; extractAllTo: '.' ] ensure: [ zipArchive close ]. eColiGCSkew := FLMaterializer materializeFromFileNamed: 'OrderedCollection_3712516797.obj'. grapher := RTGrapher new extent: 800 @ 500; yourself. ds := RTData new noDot; points: eColiGCSkew; connectColor: Color red; yourself. grapher add: ds. grapher axisY minValue: eColiGCSkew min; title: 'Skew'; color: Color black; noDecimal. grapher axisX numberOfTicks: 10; noDecimal; color: Color black; title: 'Position'. grapher open The skew_diagram_ecoli.png shows how the expected final plot should look like - obviously obtained with another software. What can I do to make it work in Roassal? Any suggestions here? Cheers, Hernán
Hi Alex, Thanks. Please note there are two questions related to Roassal :) I have isolated the script so you don't need to load BioSmalltalk Maybe someone can check or give a hint? El mar., 2 oct. 2018 a las 22:31, Alexandre Bergel (<alexandre.bergel@me.com>) escribió:
Pretty cool!
Alexandre
On Oct 2, 2018, at 2:21 AM, Hernán Morales Durand <hernan.morales@gmail.com> wrote:
<a TRMorph(28411392).png><skew_diagram_ecoli.png>
_______________________________________________ Moose-dev mailing list Moose-dev@list.inf.unibe.ch https://www.list.inf.unibe.ch/listinfo/moose-dev

I am lost. What are the questions? I do not see them in the mailing list. Alexandre
On Oct 3, 2018, at 11:11 AM, Hernán Morales Durand <hernan.morales@gmail.com> wrote:
Hi Alex,
Thanks. Please note there are two questions related to Roassal :) I have isolated the script so you don't need to load BioSmalltalk
Maybe someone can check or give a hint?
El mar., 2 oct. 2018 a las 22:31, Alexandre Bergel (<alexandre.bergel@me.com>) escribió:
Pretty cool!
Alexandre
On Oct 2, 2018, at 2:21 AM, Hernán Morales Durand <hernan.morales@gmail.com> wrote:
<a TRMorph(28411392).png><skew_diagram_ecoli.png>
_______________________________________________ Moose-dev mailing list Moose-dev@list.inf.unibe.ch https://www.list.inf.unibe.ch/listinfo/moose-dev
This is weird, could you check: http://lists.pharo.org/pipermail/pharo-users_lists.pharo.org/2018-October/04... Hernán El mié., 3 oct. 2018 a las 22:41, Alexandre Bergel (<alexandre.bergel@me.com>) escribió:
I am lost. What are the questions? I do not see them in the mailing list.
Alexandre
On Oct 3, 2018, at 11:11 AM, Hernán Morales Durand <hernan.morales@gmail.com> wrote:
Hi Alex,
Thanks. Please note there are two questions related to Roassal :) I have isolated the script so you don't need to load BioSmalltalk
Maybe someone can check or give a hint?
El mar., 2 oct. 2018 a las 22:31, Alexandre Bergel (<alexandre.bergel@me.com>) escribió:
Pretty cool!
Alexandre
On Oct 2, 2018, at 2:21 AM, Hernán Morales Durand <hernan.morales@gmail.com> wrote:
<a TRMorph(28411392).png><skew_diagram_ecoli.png>
_______________________________________________ Moose-dev mailing list Moose-dev@list.inf.unibe.ch https://www.list.inf.unibe.ch/listinfo/moose-dev
_______________________________________________ Moose-dev mailing list Moose-dev@list.inf.unibe.ch https://www.list.inf.unibe.ch/listinfo/moose-dev
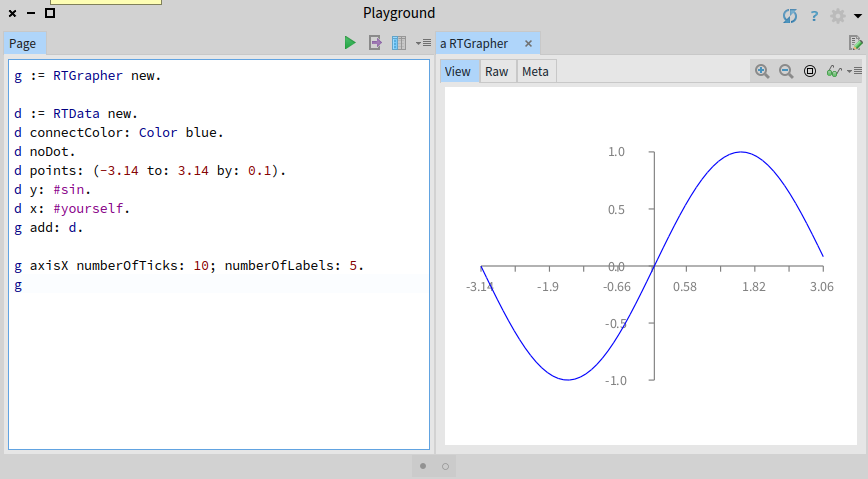
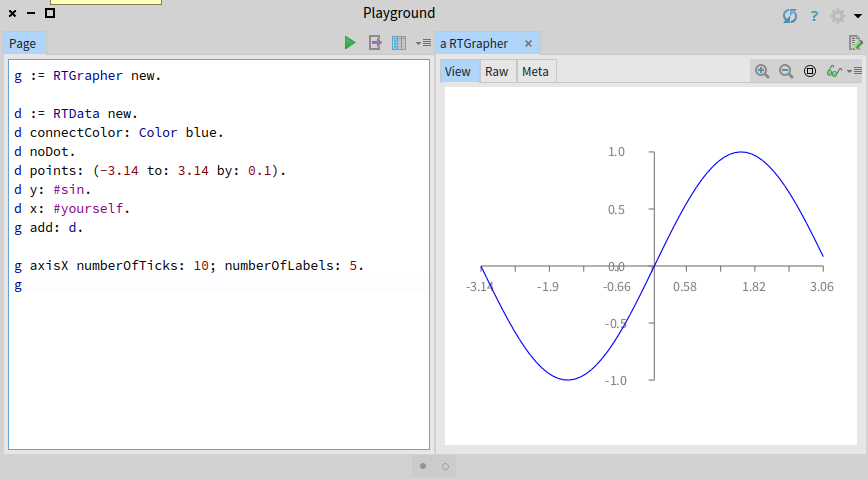
Hi Hernán, Sorry for the late reply. Regarding your first question, you can do: -=-=-=-=-=-= g := RTGrapher new. d := RTData new. d connectColor: Color blue. d noDot. d points: (-3.14 to: 3.14 by: 0.1). d y: #sin. d x: #yourself. g add: d. g axisX numberOfTicks: 10; numberOfLabels: 5. g -=-=-=-=-=-= As you can see, the line "g axisX numberOfTicks: 10; numberOfLabels: 5.â allows you to set the number of ticks and the number of labels. Regarding your second question, where can I find the file OrderedCollection_3712516797.obj ? Or, how can I reproduce it. Anyway, I believe the problem is that you have too many points. In this case, I suggest you to reduce the number of points. For example, a slight variation of the previous example [DO NOT RUN IT]: -=-=-=-=-=-= points := -3.14 to: 3.14 by: 0.000001. g := RTGrapher new. d := RTData new. d connectColor: Color blue. d noDot. d points: points. d y: #sin. d x: #yourself. g add: d. g axisX numberOfTicks: 10; numberOfLabels: 5. g -=-=-=-=-=-= The script tries to build the same graph but with 6 280 001 points. Which obviously, is way too many. Instead, you can do something like: -=-=-=-=-=-= points := SortedCollection new. 1000 timesRepeat: [ points add: (-3.14 to: 3.14 by: 0.000001) atRandom ]. g := RTGrapher new. d := RTData new. d connectColor: Color blue. d noDot. d points: points. d y: #sin. d x: #yourself. g add: d. g axisX numberOfTicks: 10; numberOfLabels: 5. g -=-=-=-=-=-= Which only display the graph with 1000 points. Cheers, Alexandre
On Oct 4, 2018, at 12:49 AM, Hernán Morales Durand <hernan.morales@gmail.com> wrote:
This is weird, could you check:
http://lists.pharo.org/pipermail/pharo-users_lists.pharo.org/2018-October/04...
Hernán
El mié., 3 oct. 2018 a las 22:41, Alexandre Bergel (<alexandre.bergel@me.com>) escribió:
I am lost. What are the questions? I do not see them in the mailing list.
Alexandre
On Oct 3, 2018, at 11:11 AM, Hernán Morales Durand <hernan.morales@gmail.com> wrote:
Hi Alex,
Thanks. Please note there are two questions related to Roassal :) I have isolated the script so you don't need to load BioSmalltalk
Maybe someone can check or give a hint?
El mar., 2 oct. 2018 a las 22:31, Alexandre Bergel (<alexandre.bergel@me.com>) escribió:
Pretty cool!
Alexandre
On Oct 2, 2018, at 2:21 AM, Hernán Morales Durand <hernan.morales@gmail.com> wrote:
<a TRMorph(28411392).png><skew_diagram_ecoli.png>
_______________________________________________ Moose-dev mailing list Moose-dev@list.inf.unibe.ch https://www.list.inf.unibe.ch/listinfo/moose-dev
_______________________________________________ Moose-dev mailing list Moose-dev@list.inf.unibe.ch https://www.list.inf.unibe.ch/listinfo/moose-dev
Hi Alex, El vie., 12 oct. 2018 a las 19:37, Alexandre Bergel (< alexandre.bergel@me.com>) escribió:
Hi Hernán,
Sorry for the late reply.
No problem, my replay is even more delayed!
Regarding your first question, you can do: -=-=-=-=-=-= g := RTGrapher new.
d := RTData new. d connectColor: Color blue. d noDot. d points: (-3.14 to: 3.14 by: 0.1). d y: #sin. d x: #yourself. g add: d.
g axisX numberOfTicks: 10; numberOfLabels: 5. g -=-=-=-=-=-= As you can see, the line "g axisX numberOfTicks: 10; numberOfLabels: 5.â allows you to set the number of ticks and the number of labels.
Thanks, with you and Milton's help I could set up the labels as I needed.
Regarding your second question, where can I find the file OrderedCollection_3712516797.obj ?
I think the attachment was truncated in the moose-dev mailing list because I received: Message body is too big: 3346796 bytes with a limit of 1000 KB However it should be accessible through the pharo-users mailing list. Let me know if you cannot download it. Or, how can I reproduce it.
Anyway, I believe the problem is that you have too many points. In this case, I suggest you to reduce the number of points.
I was reading a bit on the subject of plotting billions of points, and it seems there are libraries which can do it: http://holoviews.org/user_guide/Large_Data.html This is based on a technique they call datashading. However since I don't know Roassal internals, I cannot tell what's the fundamental difference. Is it a big change to reproduce the datashading principles in Roassal?
For example, a slight variation of the previous example [DO NOT RUN IT]: -=-=-=-=-=-= points := -3.14 to: 3.14 by: 0.000001.
g := RTGrapher new.
d := RTData new. d connectColor: Color blue. d noDot. d points: points. d y: #sin. d x: #yourself. g add: d.
g axisX numberOfTicks: 10; numberOfLabels: 5. g -=-=-=-=-=-=
The script tries to build the same graph but with 6 280 001 points. Which obviously, is way too many.
Instead, you can do something like: -=-=-=-=-=-= points := SortedCollection new. 1000 timesRepeat: [ points add: (-3.14 to: 3.14 by: 0.000001) atRandom ].
g := RTGrapher new.
d := RTData new. d connectColor: Color blue. d noDot. d points: points. d y: #sin. d x: #yourself. g add: d.
g axisX numberOfTicks: 10; numberOfLabels: 5. g -=-=-=-=-=-=
Which only display the graph with 1000 points.
If I correctly understood the idea. I could reduce my collection of x values: #(15 15 15 15 15 15 15 15 20 20 20 20 32 32 32 45 45 45 45 45 45) having repetitions count of 8 4 3 6 respectively, and set a threshold, for example 4 to obtain: #(15 15 20 45) Is that correct? Cheers, Hernán Cheers,
Alexandre
On Oct 4, 2018, at 12:49 AM, Hernán Morales Durand < hernan.morales@gmail.com> wrote:
This is weird, could you check:
http://lists.pharo.org/pipermail/pharo-users_lists.pharo.org/2018-October/04...
Hernán
El mié., 3 oct. 2018 a las 22:41, Alexandre Bergel (<alexandre.bergel@me.com>) escribió:
I am lost. What are the questions? I do not see them in the mailing list.
Alexandre
On Oct 3, 2018, at 11:11 AM, Hernán Morales Durand < hernan.morales@gmail.com> wrote:
Hi Alex,
Thanks. Please note there are two questions related to Roassal :) I have isolated the script so you don't need to load BioSmalltalk
Maybe someone can check or give a hint?
El mar., 2 oct. 2018 a las 22:31, Alexandre Bergel (<alexandre.bergel@me.com>) escribió:
Pretty cool!
Alexandre
On Oct 2, 2018, at 2:21 AM, Hernán Morales Durand < hernan.morales@gmail.com> wrote:
<a TRMorph(28411392).png><skew_diagram_ecoli.png>
_______________________________________________ Moose-dev mailing list Moose-dev@list.inf.unibe.ch https://www.list.inf.unibe.ch/listinfo/moose-dev
_______________________________________________ Moose-dev mailing list Moose-dev@list.inf.unibe.ch https://www.list.inf.unibe.ch/listinfo/moose-dev
_______________________________________________ Moose-dev mailing list Moose-dev@list.inf.unibe.ch https://www.list.inf.unibe.ch/listinfo/moose-dev
Hi Hernán,
was reading a bit on the subject of plotting billions of points, and it seems there are libraries which can do it:
http://holoviews.org/user_guide/Large_Data.html
This is based on a technique they call datashading.
However since I don't know Roassal internals, I cannot tell what's the fundamental difference. Is it a big change to reproduce the datashading principles in Roassal?
Sounds interesting. I do not think there is any showstopper to have this behavior in Roassal. I went through the documentation youâve sent. The idea is to select a subset of the points to visualize. So, yes, this is easy :-)
If I correctly understood the idea. I could reduce my collection of x values:
#(15 15 15 15 15 15 15 15 20 20 20 20 32 32 32 45 45 45 45 45 45)
having repetitions count of 8 4 3 6 respectively, and set a threshold, for example 4 to obtain:
#(15 15 20 45)
Is that correct?
Yes. You got the point. Alexandre
On Oct 28, 2018, at 5:10 PM, Hernán Morales Durand <hernan.morales@gmail.com> wrote:
Hi Alex,
El vie., 12 oct. 2018 a las 19:37, Alexandre Bergel (<alexandre.bergel@me.com>) escribió: Hi Hernán,
Sorry for the late reply.
No problem, my replay is even more delayed!
Regarding your first question, you can do: -=-=-=-=-=-= g := RTGrapher new.
d := RTData new. d connectColor: Color blue. d noDot. d points: (-3.14 to: 3.14 by: 0.1). d y: #sin. d x: #yourself. g add: d.
g axisX numberOfTicks: 10; numberOfLabels: 5. g -=-=-=-=-=-=
As you can see, the line "g axisX numberOfTicks: 10; numberOfLabels: 5.â allows you to set the number of ticks and the number of labels.
Thanks, with you and Milton's help I could set up the labels as I needed.
Regarding your second question, where can I find the file OrderedCollection_3712516797.obj ?
I think the attachment was truncated in the moose-dev mailing list because I received: Message body is too big: 3346796 bytes with a limit of 1000 KB However it should be accessible through the pharo-users mailing list. Let me know if you cannot download it.
Or, how can I reproduce it. Anyway, I believe the problem is that you have too many points. In this case, I suggest you to reduce the number of points.
I was reading a bit on the subject of plotting billions of points, and it seems there are libraries which can do it:
http://holoviews.org/user_guide/Large_Data.html
This is based on a technique they call datashading.
However since I don't know Roassal internals, I cannot tell what's the fundamental difference. Is it a big change to reproduce the datashading principles in Roassal?
For example, a slight variation of the previous example [DO NOT RUN IT]: -=-=-=-=-=-= points := -3.14 to: 3.14 by: 0.000001.
g := RTGrapher new.
d := RTData new. d connectColor: Color blue. d noDot. d points: points. d y: #sin. d x: #yourself. g add: d.
g axisX numberOfTicks: 10; numberOfLabels: 5. g -=-=-=-=-=-=
The script tries to build the same graph but with 6 280 001 points. Which obviously, is way too many.
Instead, you can do something like: -=-=-=-=-=-= points := SortedCollection new. 1000 timesRepeat: [ points add: (-3.14 to: 3.14 by: 0.000001) atRandom ].
g := RTGrapher new.
d := RTData new. d connectColor: Color blue. d noDot. d points: points. d y: #sin. d x: #yourself. g add: d.
g axisX numberOfTicks: 10; numberOfLabels: 5. g -=-=-=-=-=-=
Which only display the graph with 1000 points.
If I correctly understood the idea. I could reduce my collection of x values:
#(15 15 15 15 15 15 15 15 20 20 20 20 32 32 32 45 45 45 45 45 45)
having repetitions count of 8 4 3 6 respectively, and set a threshold, for example 4 to obtain:
#(15 15 20 45)
Is that correct?
Cheers,
Hernán
Cheers, Alexandre
On Oct 4, 2018, at 12:49 AM, Hernán Morales Durand <hernan.morales@gmail.com> wrote:
This is weird, could you check:
http://lists.pharo.org/pipermail/pharo-users_lists.pharo.org/2018-October/04...
Hernán
El mié., 3 oct. 2018 a las 22:41, Alexandre Bergel (<alexandre.bergel@me.com>) escribió:
I am lost. What are the questions? I do not see them in the mailing list.
Alexandre
On Oct 3, 2018, at 11:11 AM, Hernán Morales Durand <hernan.morales@gmail.com> wrote:
Hi Alex,
Thanks. Please note there are two questions related to Roassal :) I have isolated the script so you don't need to load BioSmalltalk
Maybe someone can check or give a hint?
El mar., 2 oct. 2018 a las 22:31, Alexandre Bergel (<alexandre.bergel@me.com>) escribió:
Pretty cool!
Alexandre
On Oct 2, 2018, at 2:21 AM, Hernán Morales Durand <hernan.morales@gmail.com> wrote:
<a TRMorph(28411392).png><skew_diagram_ecoli.png>
_______________________________________________ Moose-dev mailing list Moose-dev@list.inf.unibe.ch https://www.list.inf.unibe.ch/listinfo/moose-dev
_______________________________________________ Moose-dev mailing list Moose-dev@list.inf.unibe.ch https://www.list.inf.unibe.ch/listinfo/moose-dev
_______________________________________________ Moose-dev mailing list Moose-dev@list.inf.unibe.ch https://www.list.inf.unibe.ch/listinfo/moose-dev <Screenshot 2018-10-12 19.35.44.png><Screenshot 2018-10-12 19.35.44.png>
participants (2)
-
 Alexandre Bergel
 -
 Hernán Morales Durand