
Hi! So far 133 copies of Deep Into Pharo have been sold. I used Roassal2 to visualize countries Here is a screenshot: The data are embedded within the distribution of Roassal2. Just execute: RTMetricMap new example06DeepIntoPharo and you will get the same rendering. The map builder has attracted some interest. Here is a small example on how you can render you own data. First of all, you need some data. Usually, you get data in a tabular table. For example, I just stumbled on http://www.gdbridge.org/gdb_index I copy and paste the small columns on the right hand side of the web page into a string in a workspace. I then convert the third column as floats. I paint all countries in white. I then paint countries from the table using the first column as a name, and the third column as a color gradient -=-=-=-=-=-=-=-=-=-=-=-=-=-=-= | b table | b := RTMetricMap new. table := RTTabTable new. table input: 'Hong Kong, China 1 0.631447 Singapore 2 0.5889286 Netherlands 3 0.515425 Switzerland 4 0.5018929 United States 5 0.4871152 Norway 6 0.4851121 Denmark 7 0.4665922 Sweden 8 0.4567912 Finland 9 0.4460537 Korea, Rep. 10 0.4382369 Ireland 11 0.4324097 Luxembourg 12 0.4227912 Germany 13 0.4190357 Belgium 14 0.4022478 Canada 15 0.3983661 Australia 16 0.3982408 United Kingdom 17 0.3930691 Japan 18 0.3904902 Spain 19 0.3876414 Kuwait 20 0.3800776 France 21 0.377015 Brunei Darussalam 22 0.3627484 Austria 23 0.3621858 Israel 24 0.3585244 China 25 0.3560882' usingDelimiters: String tab. table convertColumn: 3 to: [ :t | Float readFrom: t ]. b allCountriesColor: Color white. b countries: table values named: #first metric: #third. b open -=-=-=-=-=-=-=-=-=-=-=-=-=-=-= Oh⦠almost forgot. You can export a visualization on the web. Here is the generated HTML for the sells https://dl.dropboxusercontent.com/u/31543901/online/DeepIntoPharoUntilMarch2... Cheers, Alexandre -- _,.;:~^~:;._,.;:~^~:;._,.;:~^~:;._,.;:~^~:;._,.;: Alexandre Bergel http://www.bergel.eu ^~:;._,.;:~^~:;._,.;:~^~:;._,.;:~^~:;._,.;:~^~:;.

Hm, I'm from Russia and I have bought 'Deep into Pharo'' some months ago! -- View this message in context: http://forum.world.st/Sells-of-Deep-Into-Pharo-tp4751716p4751722.html Sent from the Pharo Smalltalk Developers mailing list archive at Nabble.com.

Nice! Doru On Sun, Mar 30, 2014 at 5:47 PM, Alexandre Bergel <alexandre.bergel@me.com>wrote:
Hi!
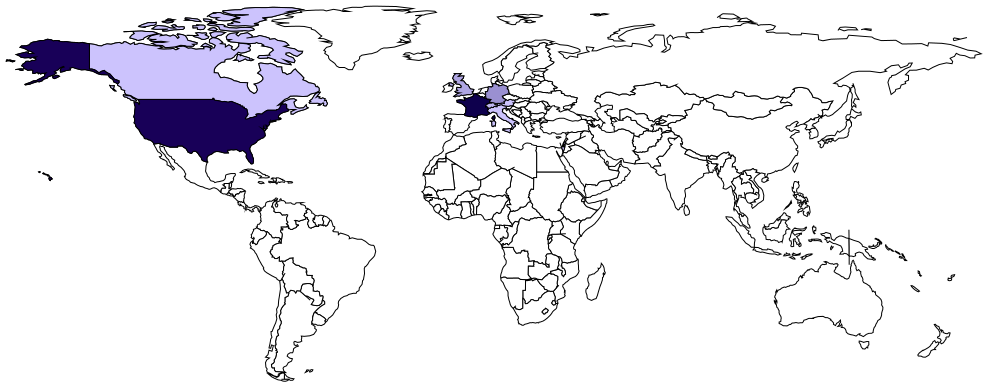
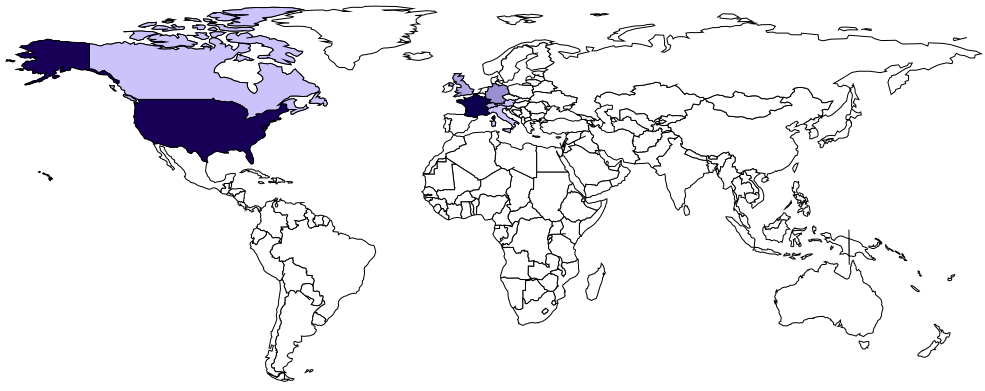
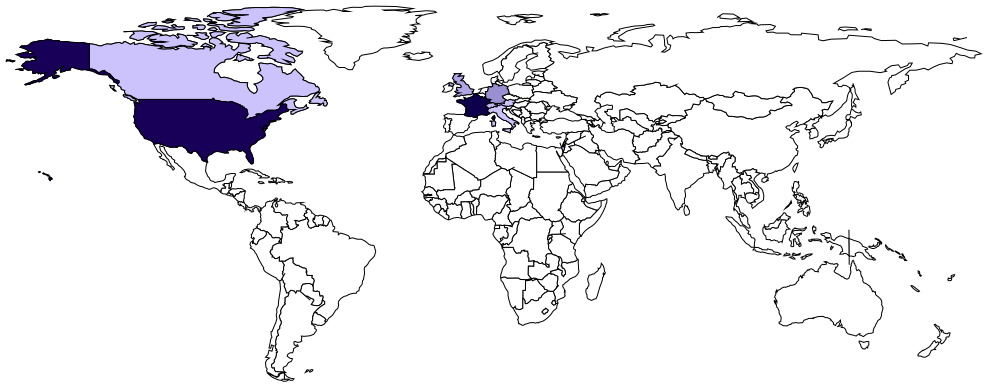
So far 133 copies of Deep Into Pharo have been sold. I used Roassal2 to visualize countries Here is a screenshot:
The data are embedded within the distribution of Roassal2. Just execute: RTMetricMap new example06DeepIntoPharo and you will get the same rendering.
The map builder has attracted some interest. Here is a small example on how you can render you own data. First of all, you need some data. Usually, you get data in a tabular table. For example, I just stumbled on http://www.gdbridge.org/gdb_index I copy and paste the small columns on the right hand side of the web page into a string in a workspace. I then convert the third column as floats. I paint all countries in white. I then paint countries from the table using the first column as a name, and the third column as a color gradient
-=-=-=-=-=-=-=-=-=-=-=-=-=-=-= | b table | b := RTMetricMap new. table := RTTabTable new. table input: 'Hong Kong, China 1 0.631447 Singapore 2 0.5889286 Netherlands 3 0.515425 Switzerland 4 0.5018929 United States 5 0.4871152 Norway 6 0.4851121 Denmark 7 0.4665922 Sweden 8 0.4567912 Finland 9 0.4460537 Korea, Rep. 10 0.4382369 Ireland 11 0.4324097 Luxembourg 12 0.4227912 Germany 13 0.4190357 Belgium 14 0.4022478 Canada 15 0.3983661 Australia 16 0.3982408 United Kingdom 17 0.3930691 Japan 18 0.3904902 Spain 19 0.3876414 Kuwait 20 0.3800776 France 21 0.377015 Brunei Darussalam 22 0.3627484 Austria 23 0.3621858 Israel 24 0.3585244 China 25 0.3560882' usingDelimiters: String tab. table convertColumn: 3 to: [ :t | Float readFrom: t ].
b allCountriesColor: Color white. b countries: table values named: #first metric: #third.
b open -=-=-=-=-=-=-=-=-=-=-=-=-=-=-=
Oh... almost forgot. You can export a visualization on the web. Here is the generated HTML for the sells
https://dl.dropboxusercontent.com/u/31543901/online/DeepIntoPharoUntilMarch2...
Cheers, Alexandre -- _,.;:~^~:;._,.;:~^~:;._,.;:~^~:;._,.;:~^~:;._,.;: Alexandre Bergel http://www.bergel.eu ^~:;._,.;:~^~:;._,.;:~^~:;._,.;:~^~:;._,.;:~^~:;.
-- www.tudorgirba.com "Every thing has its own flow"

Well I can safely say your number is wrong since I also bought the book when it was released and I am from Greece ;) Interesting map, thanks for sharing. How you know the nationality of the person buying the book ? On Sun, Mar 30, 2014 at 8:49 PM, Tudor Girba <tudor@tudorgirba.com> wrote:
Nice!
Doru
On Sun, Mar 30, 2014 at 5:47 PM, Alexandre Bergel <alexandre.bergel@me.com
wrote:
Hi!
So far 133 copies of Deep Into Pharo have been sold. I used Roassal2 to visualize countries Here is a screenshot:
The data are embedded within the distribution of Roassal2. Just execute: RTMetricMap new example06DeepIntoPharo and you will get the same rendering.
The map builder has attracted some interest. Here is a small example on how you can render you own data. First of all, you need some data. Usually, you get data in a tabular table. For example, I just stumbled on http://www.gdbridge.org/gdb_index I copy and paste the small columns on the right hand side of the web page into a string in a workspace. I then convert the third column as floats. I paint all countries in white. I then paint countries from the table using the first column as a name, and the third column as a color gradient
-=-=-=-=-=-=-=-=-=-=-=-=-=-=-= | b table | b := RTMetricMap new. table := RTTabTable new. table input: 'Hong Kong, China 1 0.631447 Singapore 2 0.5889286 Netherlands 3 0.515425 Switzerland 4 0.5018929 United States 5 0.4871152 Norway 6 0.4851121 Denmark 7 0.4665922 Sweden 8 0.4567912 Finland 9 0.4460537 Korea, Rep. 10 0.4382369 Ireland 11 0.4324097 Luxembourg 12 0.4227912 Germany 13 0.4190357 Belgium 14 0.4022478 Canada 15 0.3983661 Australia 16 0.3982408 United Kingdom 17 0.3930691 Japan 18 0.3904902 Spain 19 0.3876414 Kuwait 20 0.3800776 France 21 0.377015 Brunei Darussalam 22 0.3627484 Austria 23 0.3621858 Israel 24 0.3585244 China 25 0.3560882' usingDelimiters: String tab. table convertColumn: 3 to: [ :t | Float readFrom: t ].
b allCountriesColor: Color white. b countries: table values named: #first metric: #third.
b open -=-=-=-=-=-=-=-=-=-=-=-=-=-=-=
Oh... almost forgot. You can export a visualization on the web. Here is the generated HTML for the sells
https://dl.dropboxusercontent.com/u/31543901/online/DeepIntoPharoUntilMarch2...
Cheers, Alexandre -- _,.;:~^~:;._,.;:~^~:;._,.;:~^~:;._,.;:~^~:;._,.;: Alexandre Bergel http://www.bergel.eu ^~:;._,.;:~^~:;._,.;:~^~:;._,.;:~^~:;._,.;:~^~:;.
-- www.tudorgirba.com
"Every thing has its own flow"

Hi! The map is built using the information given by lulu. I just have manually checked, and some region are marked as âEUâ. I guess this comprises Greece and some other. In any case, I sincerely want to apology about the wrong info. Cheers, Alexandre On Mar 30, 2014, at 3:55 PM, kilon alios <kilon.alios@gmail.com> wrote:
Well I can safely say your number is wrong since I also bought the book when it was released and I am from Greece ;)
Interesting map, thanks for sharing.
How you know the nationality of the person buying the book ?
On Sun, Mar 30, 2014 at 8:49 PM, Tudor Girba <tudor@tudorgirba.com> wrote: Nice!
Doru
On Sun, Mar 30, 2014 at 5:47 PM, Alexandre Bergel <alexandre.bergel@me.com> wrote: Hi!
So far 133 copies of Deep Into Pharo have been sold. I used Roassal2 to visualize countries Here is a screenshot: <Screen Shot 2014-03-30 at 12.32.28 PM.png>
The data are embedded within the distribution of Roassal2. Just execute: RTMetricMap new example06DeepIntoPharo and you will get the same rendering.
The map builder has attracted some interest. Here is a small example on how you can render you own data. First of all, you need some data. Usually, you get data in a tabular table. For example, I just stumbled on http://www.gdbridge.org/gdb_index I copy and paste the small columns on the right hand side of the web page into a string in a workspace. I then convert the third column as floats. I paint all countries in white. I then paint countries from the table using the first column as a name, and the third column as a color gradient
-=-=-=-=-=-=-=-=-=-=-=-=-=-=-= | b table | b := RTMetricMap new. table := RTTabTable new. table input: 'Hong Kong, China 1 0.631447 Singapore 2 0.5889286 Netherlands 3 0.515425 Switzerland 4 0.5018929 United States 5 0.4871152 Norway 6 0.4851121 Denmark 7 0.4665922 Sweden 8 0.4567912 Finland 9 0.4460537 Korea, Rep. 10 0.4382369 Ireland 11 0.4324097 Luxembourg 12 0.4227912 Germany 13 0.4190357 Belgium 14 0.4022478 Canada 15 0.3983661 Australia 16 0.3982408 United Kingdom 17 0.3930691 Japan 18 0.3904902 Spain 19 0.3876414 Kuwait 20 0.3800776 France 21 0.377015 Brunei Darussalam 22 0.3627484 Austria 23 0.3621858 Israel 24 0.3585244 China 25 0.3560882' usingDelimiters: String tab. table convertColumn: 3 to: [ :t | Float readFrom: t ].
b allCountriesColor: Color white. b countries: table values named: #first metric: #third.
b open -=-=-=-=-=-=-=-=-=-=-=-=-=-=-=
Oh⦠almost forgot. You can export a visualization on the web. Here is the generated HTML for the sells https://dl.dropboxusercontent.com/u/31543901/online/DeepIntoPharoUntilMarch2...
Cheers, Alexandre -- _,.;:~^~:;._,.;:~^~:;._,.;:~^~:;._,.;:~^~:;._,.;: Alexandre Bergel http://www.bergel.eu ^~:;._,.;:~^~:;._,.;:~^~:;._,.;:~^~:;._,.;:~^~:;.
-- www.tudorgirba.com
"Every thing has its own flow"
-- _,.;:~^~:;._,.;:~^~:;._,.;:~^~:;._,.;:~^~:;._,.;: Alexandre Bergel http://www.bergel.eu ^~:;._,.;:~^~:;._,.;:~^~:;._,.;:~^~:;._,.;:~^~:;.
no apology is needed , I just mention it just in case there are more people that bought the book than you thought. Very nice to see interest for Pharo all over the world. You certainly deserve it. "Where it is shipped to, probably ;-)" Ah yes I should have guessed that :) On Sun, Mar 30, 2014 at 10:57 PM, Alexandre Bergel <alexandre.bergel@me.com>wrote:
Hi!
The map is built using the information given by lulu. I just have manually checked, and some region are marked as "EU". I guess this comprises Greece and some other.
In any case, I sincerely want to apology about the wrong info.
Cheers, Alexandre
On Mar 30, 2014, at 3:55 PM, kilon alios <kilon.alios@gmail.com> wrote:
Well I can safely say your number is wrong since I also bought the book when it was released and I am from Greece ;)
Interesting map, thanks for sharing.
How you know the nationality of the person buying the book ?
On Sun, Mar 30, 2014 at 8:49 PM, Tudor Girba <tudor@tudorgirba.com> wrote: Nice!
Doru
On Sun, Mar 30, 2014 at 5:47 PM, Alexandre Bergel < alexandre.bergel@me.com> wrote: Hi!
So far 133 copies of Deep Into Pharo have been sold. I used Roassal2 to visualize countries Here is a screenshot: <Screen Shot 2014-03-30 at 12.32.28 PM.png>
The data are embedded within the distribution of Roassal2. Just execute: RTMetricMap new example06DeepIntoPharo and you will get the same rendering.
The map builder has attracted some interest. Here is a small example on how you can render you own data. First of all, you need some data. Usually, you get data in a tabular table. For example, I just stumbled on http://www.gdbridge.org/gdb_index I copy and paste the small columns on the right hand side of the web page into a string in a workspace. I then convert the third column as floats. I paint all countries in white. I then paint countries from the table using the first column as a name, and the third column as a color gradient
-=-=-=-=-=-=-=-=-=-=-=-=-=-=-= | b table | b := RTMetricMap new. table := RTTabTable new. table input: 'Hong Kong, China 1 0.631447 Singapore 2 0.5889286 Netherlands 3 0.515425 Switzerland 4 0.5018929 United States 5 0.4871152 Norway 6 0.4851121 Denmark 7 0.4665922 Sweden 8 0.4567912 Finland 9 0.4460537 Korea, Rep. 10 0.4382369 Ireland 11 0.4324097 Luxembourg 12 0.4227912 Germany 13 0.4190357 Belgium 14 0.4022478 Canada 15 0.3983661 Australia 16 0.3982408 United Kingdom 17 0.3930691 Japan 18 0.3904902 Spain 19 0.3876414 Kuwait 20 0.3800776 France 21 0.377015 Brunei Darussalam 22 0.3627484 Austria 23 0.3621858 Israel 24 0.3585244 China 25 0.3560882' usingDelimiters: String tab. table convertColumn: 3 to: [ :t | Float readFrom: t ].
b allCountriesColor: Color white. b countries: table values named: #first metric: #third.
b open -=-=-=-=-=-=-=-=-=-=-=-=-=-=-=
Oh... almost forgot. You can export a visualization on the web. Here is the generated HTML for the sells
https://dl.dropboxusercontent.com/u/31543901/online/DeepIntoPharoUntilMarch2...
Cheers, Alexandre -- _,.;:~^~:;._,.;:~^~:;._,.;:~^~:;._,.;:~^~:;._,.;: Alexandre Bergel http://www.bergel.eu ^~:;._,.;:~^~:;._,.;:~^~:;._,.;:~^~:;._,.;:~^~:;.
-- www.tudorgirba.com
"Every thing has its own flow"
-- _,.;:~^~:;._,.;:~^~:;._,.;:~^~:;._,.;:~^~:;._,.;: Alexandre Bergel http://www.bergel.eu ^~:;._,.;:~^~:;._,.;:~^~:;._,.;:~^~:;._,.;:~^~:;.
participants (5)
-
 Alexandre Bergel
 -
 kilon alios
 -
 Sven Van Caekenberghe
 -
 Tudor Girba
 -
 vmusulainen