2016-01-08 12:48 GMT-03:00 Esteban Lorenzano <estebanlm@gmail.com>:
On 08 Jan 2016, at 16:43, Andrei Chis <chisvasileandrei@gmail.com> wrote:
Hi Nicolai,
Thanks for the feedback. Some issues I'll manage to fix until we integrate. For those that I do not manage please open bug reports.
On Thu, Jan 7, 2016 at 9:13 PM, Nicolai Hess <nicolaihess@gmail.com>
wrote:
Some feedback on GTDebugger
- The inspector pane is great, we can inspect, evaluate code, and easily show/ inspect the code (for thisContext). although the evaluator pane has a bad text mode (for the thisContext).
Can you give me more details? Maybe it's obvious but I'm missing what's wrong :)
Cheers, Andrei
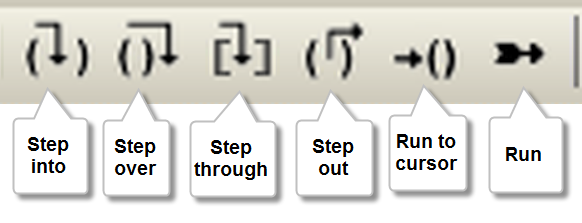
- I think the buttons are too small and the icon for "stop over" is misleading, it looks like a "step outâ
+1 to this, I had to hover it to realize it. The best icons I found for these features are the ones from Dolphin Smalltalk (now opensourced ;-) ) [image: Imágenes integradas 1]
for me they are not small, but misplaced. I expect to have them close to where Iâm looking for: the code (that happens in all debuggers I know,
with
the exception of ddd who opens a different window). For me, they should be in the code panel and not in the stack panel. also⦠shortcuts do not work in code panel :(
+1 to this. Altough if you use shortcuts you don't care where they are located. BTW, is it possible to use the function keys as shortcuts? I would map F10-F12 (with modifiers) as shortcuts. Regards! Esteban A. Maringolo