GTDebugger (case 17341 Integrate GTools version 3.3)

Some feedback on GTDebugger - The inspector pane is great, we can inspect, evaluate code, and easily show/ inspect the code (for thisContext). although the evaluator pane has a bad text mode (for the thisContext). - I think the buttons are too small and the icon for "stop over" is misleading, it looks like a "step out" - the shortcuts (neither ctrl+t nor cmd+t) aren't working - I find it totally annoying and useless that the context pane inspector scrolls away if you select a value in the rightmost pane. The context inspector should be fixed. - I really miss the "List Methods using 'varname'/List Methods storing into 'varname' - the stacklist entry for block closures prints the block closure code, this is confusing (too much text for such a small widget). nicolai

Hi Nicolai, Thanks for the feedback. Some issues I'll manage to fix until we integrate. For those that I do not manage please open bug reports. On Thu, Jan 7, 2016 at 9:13 PM, Nicolai Hess <nicolaihess@gmail.com> wrote:
Some feedback on GTDebugger
- The inspector pane is great, we can inspect, evaluate code, and easily show/ inspect the code (for thisContext). although the evaluator pane has a bad text mode (for the thisContext).
Can you give me more details? Maybe it's obvious but I'm missing what's wrong :) Cheers, Andrei
- I think the buttons are too small and the icon for "stop over" is misleading, it looks like a "step out" - the shortcuts (neither ctrl+t nor cmd+t) aren't working - I find it totally annoying and useless that the context pane inspector scrolls away if you select a value in the rightmost pane. The context inspector should be fixed. - I really miss the "List Methods using 'varname'/List Methods storing into 'varname' - the stacklist entry for block closures prints the block closure code, this is confusing (too much text for such a small widget).
nicolai

On 08 Jan 2016, at 16:43, Andrei Chis <chisvasileandrei@gmail.com> wrote:
Hi Nicolai,
Thanks for the feedback. Some issues I'll manage to fix until we integrate. For those that I do not manage please open bug reports.
On Thu, Jan 7, 2016 at 9:13 PM, Nicolai Hess <nicolaihess@gmail.com <mailto:nicolaihess@gmail.com>> wrote: Some feedback on GTDebugger
- The inspector pane is great, we can inspect, evaluate code, and easily show/ inspect the code (for thisContext). although the evaluator pane has a bad text mode (for the thisContext).
Can you give me more details? Maybe it's obvious but I'm missing what's wrong :)
Cheers, Andrei
- I think the buttons are too small and the icon for "stop over" is misleading, it looks like a "step outâ
for me they are not small, but misplaced. I expect to have them close to where Iâm looking for: the code (that happens in all debuggers I know, with the exception of ddd who opens a different window). For me, they should be in the code panel and not in the stack panel. also⦠shortcuts do not work in code panel :( Esteban
- the shortcuts (neither ctrl+t nor cmd+t) aren't working - I find it totally annoying and useless that the context pane inspector scrolls away if you select a value in the rightmost pane. The context inspector should be fixed. - I really miss the "List Methods using 'varname'/List Methods storing into 'varname' - the stacklist entry for block closures prints the block closure code, this is confusing (too much text for such a small widget).
nicolai

2016-01-08 12:48 GMT-03:00 Esteban Lorenzano <estebanlm@gmail.com>:
On 08 Jan 2016, at 16:43, Andrei Chis <chisvasileandrei@gmail.com> wrote:
Hi Nicolai,
Thanks for the feedback. Some issues I'll manage to fix until we integrate. For those that I do not manage please open bug reports.
On Thu, Jan 7, 2016 at 9:13 PM, Nicolai Hess <nicolaihess@gmail.com>
wrote:
Some feedback on GTDebugger
- The inspector pane is great, we can inspect, evaluate code, and easily show/ inspect the code (for thisContext). although the evaluator pane has a bad text mode (for the thisContext).
Can you give me more details? Maybe it's obvious but I'm missing what's wrong :)
Cheers, Andrei
- I think the buttons are too small and the icon for "stop over" is misleading, it looks like a "step outâ
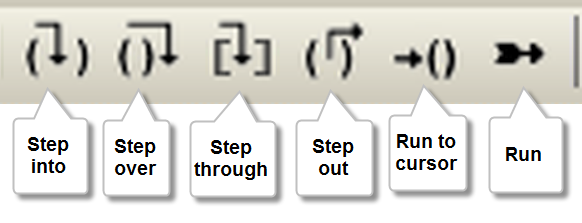
+1 to this, I had to hover it to realize it. The best icons I found for these features are the ones from Dolphin Smalltalk (now opensourced ;-) ) [image: Imágenes integradas 1]
for me they are not small, but misplaced. I expect to have them close to where Iâm looking for: the code (that happens in all debuggers I know,
with
the exception of ddd who opens a different window). For me, they should be in the code panel and not in the stack panel. also⦠shortcuts do not work in code panel :(
+1 to this. Altough if you use shortcuts you don't care where they are located. BTW, is it possible to use the function keys as shortcuts? I would map F10-F12 (with modifiers) as shortcuts. Regards! Esteban A. Maringolo
On 08 Jan 2016, at 17:04, Esteban A. Maringolo <emaringolo@gmail.com> wrote:
2016-01-08 12:48 GMT-03:00 Esteban Lorenzano <estebanlm@gmail.com <mailto:estebanlm@gmail.com>>:
On 08 Jan 2016, at 16:43, Andrei Chis <chisvasileandrei@gmail.com <mailto:chisvasileandrei@gmail.com>> wrote:
Hi Nicolai,
Thanks for the feedback. Some issues I'll manage to fix until we integrate. For those that I do not manage please open bug reports.
On Thu, Jan 7, 2016 at 9:13 PM, Nicolai Hess <nicolaihess@gmail.com <mailto:nicolaihess@gmail.com>> wrote:
Some feedback on GTDebugger
- The inspector pane is great, we can inspect, evaluate code, and easily show/ inspect the code (for thisContext). although the evaluator pane has a bad text mode (for the thisContext).
Can you give me more details? Maybe it's obvious but I'm missing what's wrong :)
Cheers, Andrei
- I think the buttons are too small and the icon for "stop over" is misleading, it looks like a "step outâ
+1 to this, I had to hover it to realize it.
The best icons I found for these features are the ones from Dolphin Smalltalk (now opensourced ;-) )
<dolphin-dbg.png>
they are more or less equal. also we will not mix button sets :)
for me they are not small, but misplaced. I expect to have them close to where Iâm looking for: the code (that happens in all debuggers I know, with the exception of ddd who opens a different window). For me, they should be in the code panel and not in the stack panel. also⦠shortcuts do not work in code panel :(
+1 to this. Altough if you use shortcuts you don't care where they are located.
yes you care⦠I use both :)
BTW, is it possible to use the function keys as shortcuts? I would map F10-F12 (with modifiers) as shortcuts.
thatâs not possible⦠they are taken by O.S. usually. Esteban
Regards!
Esteban A. Maringolo
2016-01-08 16:48 GMT+01:00 Esteban Lorenzano <estebanlm@gmail.com>:
On 08 Jan 2016, at 16:43, Andrei Chis <chisvasileandrei@gmail.com> wrote:
Hi Nicolai,
Thanks for the feedback. Some issues I'll manage to fix until we integrate. For those that I do not manage please open bug reports.
On Thu, Jan 7, 2016 at 9:13 PM, Nicolai Hess <nicolaihess@gmail.com> wrote:
Some feedback on GTDebugger
- The inspector pane is great, we can inspect, evaluate code, and easily show/ inspect the code (for thisContext). although the evaluator pane has a bad text mode (for the thisContext).
Can you give me more details? Maybe it's obvious but I'm missing what's wrong :)
Cheers, Andrei
- I think the buttons are too small and the icon for "stop over" is misleading, it looks like a "step outâ
for me they are not small, but misplaced. I expect to have them close to where Iâm looking for: the code (that happens in all debuggers I know, with the exception of ddd who opens a different window). For me, they should be in the code panel and not in the stack panel. also⦠shortcuts do not work in code panel :(
Maybe a small margin between the buttons ? It often happens to me that I press the wrong button (step into instead of step over).
Esteban
- the shortcuts (neither ctrl+t nor cmd+t) aren't working
- I find it totally annoying and useless that the context pane inspector scrolls away if you select a value in the rightmost pane. The context inspector should be fixed. - I really miss the "List Methods using 'varname'/List Methods storing into 'varname' - the stacklist entry for block closures prints the block closure code, this is confusing (too much text for such a small widget).
nicolai
2016-01-08 16:43 GMT+01:00 Andrei Chis <chisvasileandrei@gmail.com>:
Hi Nicolai,
Thanks for the feedback. Some issues I'll manage to fix until we integrate. For those that I do not manage please open bug reports.
On Thu, Jan 7, 2016 at 9:13 PM, Nicolai Hess <nicolaihess@gmail.com> wrote:
Some feedback on GTDebugger
- The inspector pane is great, we can inspect, evaluate code, and easily show/ inspect the code (for thisContext). although the evaluator pane has a bad text mode (for the thisContext).
Can you give me more details? Maybe it's obvious but I'm missing what's wrong :)
Hm, I can not reproduce it anymore.
Cheers, Andrei
- I think the buttons are too small and the icon for "stop over" is misleading, it looks like a "step out" - the shortcuts (neither ctrl+t nor cmd+t) aren't working - I find it totally annoying and useless that the context pane inspector scrolls away if you select a value in the rightmost pane. The context inspector should be fixed. - I really miss the "List Methods using 'varname'/List Methods storing into 'varname' - the stacklist entry for block closures prints the block closure code, this is confusing (too much text for such a small widget).
nicolai
2016-01-08 22:48 GMT+01:00 Nicolai Hess <nicolaihess@gmail.com>:
2016-01-08 16:43 GMT+01:00 Andrei Chis <chisvasileandrei@gmail.com>:
Hi Nicolai,
Thanks for the feedback. Some issues I'll manage to fix until we integrate. For those that I do not manage please open bug reports.
On Thu, Jan 7, 2016 at 9:13 PM, Nicolai Hess <nicolaihess@gmail.com> wrote:
Some feedback on GTDebugger
- The inspector pane is great, we can inspect, evaluate code, and easily show/ inspect the code (for thisContext). although the evaluator pane has a bad text mode (for the thisContext).
Can you give me more details? Maybe it's obvious but I'm missing what's wrong :)
Hm, I can not reproduce it anymore.
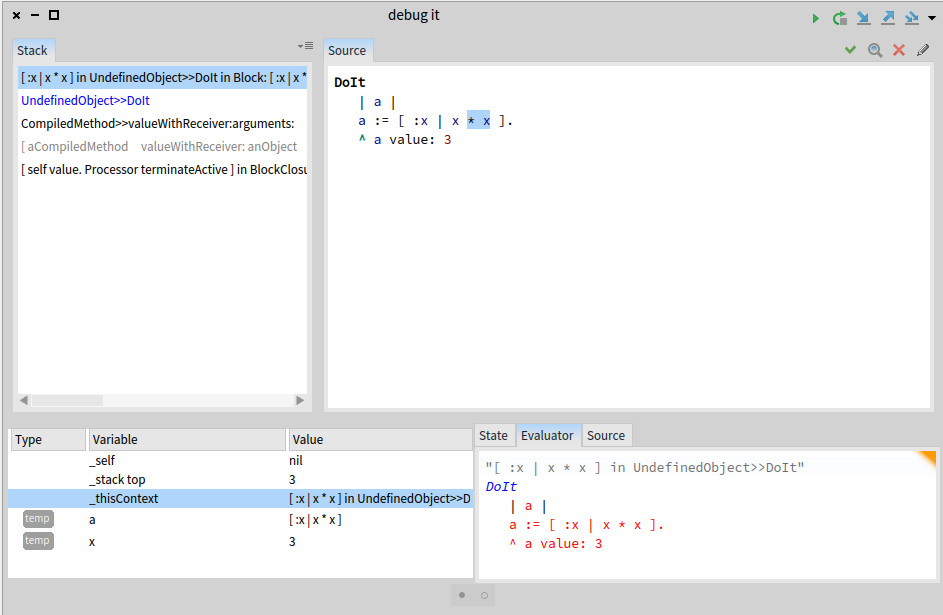
Ok, now it happened again. See screenshot, the thisContext evaluator pane is wrong. And it does not go away (every debugger now shows this text, even if I debug a totally different method)
Cheers, Andrei
- I think the buttons are too small and the icon for "stop over" is misleading, it looks like a "step out" - the shortcuts (neither ctrl+t nor cmd+t) aren't working - I find it totally annoying and useless that the context pane inspector scrolls away if you select a value in the rightmost pane. The context inspector should be fixed. - I really miss the "List Methods using 'varname'/List Methods storing into 'varname' - the stacklist entry for block closures prints the block closure code, this is confusing (too much text for such a small widget).
nicolai
2016-01-08 22:55 GMT+01:00 Nicolai Hess <nicolaihess@gmail.com>:
2016-01-08 22:48 GMT+01:00 Nicolai Hess <nicolaihess@gmail.com>:
2016-01-08 16:43 GMT+01:00 Andrei Chis <chisvasileandrei@gmail.com>:
Hi Nicolai,
Thanks for the feedback. Some issues I'll manage to fix until we integrate. For those that I do not manage please open bug reports.
On Thu, Jan 7, 2016 at 9:13 PM, Nicolai Hess <nicolaihess@gmail.com> wrote:
Some feedback on GTDebugger
- The inspector pane is great, we can inspect, evaluate code, and easily show/ inspect the code (for thisContext). although the evaluator pane has a bad text mode (for the thisContext).
Can you give me more details? Maybe it's obvious but I'm missing what's wrong :)
Hm, I can not reproduce it anymore.
Ok, now it happened again. See screenshot, the thisContext evaluator pane is wrong. And it does not go away (every debugger now shows this text, even if I debug a totally different method)
How to reporduce: select some code and debugIt in the debugger select thisContex select the Evaluator pane, now select the Source pane close debugger open debugger again select Evaluator pane -> it will always show the last source pane text in the Evaluator pane
Cheers, Andrei
- I think the buttons are too small and the icon for "stop over" is misleading, it looks like a "step out" - the shortcuts (neither ctrl+t nor cmd+t) aren't working - I find it totally annoying and useless that the context pane inspector scrolls away if you select a value in the rightmost pane. The context inspector should be fixed. - I really miss the "List Methods using 'varname'/List Methods storing into 'varname' - the stacklist entry for block closures prints the block closure code, this is confusing (too much text for such a small widget).
nicolai

This is a fun one. I think the reason comes from incorrect printing as comment. Please open a bug for this. Cheers, Doru
On Jan 9, 2016, at 12:16 AM, Nicolai Hess <nicolaihess@gmail.com> wrote:
2016-01-08 22:55 GMT+01:00 Nicolai Hess <nicolaihess@gmail.com>:
2016-01-08 22:48 GMT+01:00 Nicolai Hess <nicolaihess@gmail.com>:
2016-01-08 16:43 GMT+01:00 Andrei Chis <chisvasileandrei@gmail.com>: Hi Nicolai,
Thanks for the feedback. Some issues I'll manage to fix until we integrate. For those that I do not manage please open bug reports.
On Thu, Jan 7, 2016 at 9:13 PM, Nicolai Hess <nicolaihess@gmail.com> wrote: Some feedback on GTDebugger
- The inspector pane is great, we can inspect, evaluate code, and easily show/ inspect the code (for thisContext). although the evaluator pane has a bad text mode (for the thisContext).
Can you give me more details? Maybe it's obvious but I'm missing what's wrong :)
Hm, I can not reproduce it anymore.
Ok, now it happened again. See screenshot, the thisContext evaluator pane is wrong. And it does not go away (every debugger now shows this text, even if I debug a totally different method)
How to reporduce:
select some code and debugIt in the debugger select thisContex select the Evaluator pane, now select the Source pane close debugger open debugger again select Evaluator pane -> it will always show the last source pane text in the Evaluator pane
Cheers, Andrei
- I think the buttons are too small and the icon for "stop over" is misleading, it looks like a "step out" - the shortcuts (neither ctrl+t nor cmd+t) aren't working - I find it totally annoying and useless that the context pane inspector scrolls away if you select a value in the rightmost pane. The context inspector should be fixed. - I really miss the "List Methods using 'varname'/List Methods storing into 'varname' - the stacklist entry for block closures prints the block closure code, this is confusing (too much text for such a small widget).
nicolai
-- www.tudorgirba.com www.feenk.com "Reasonable is what we are accustomed with."

Why do we need thisContext? Le 8/1/16 23:16, Nicolai Hess a écrit :
2016-01-08 22:55 GMT+01:00 Nicolai Hess <nicolaihess@gmail.com <mailto:nicolaihess@gmail.com>>:
2016-01-08 22:48 GMT+01:00 Nicolai Hess <nicolaihess@gmail.com <mailto:nicolaihess@gmail.com>>:
2016-01-08 16:43 GMT+01:00 Andrei Chis <chisvasileandrei@gmail.com <mailto:chisvasileandrei@gmail.com>>:
Hi Nicolai,
Thanks for the feedback. Some issues I'll manage to fix until we integrate. For those that I do not manage please open bug reports.
On Thu, Jan 7, 2016 at 9:13 PM, Nicolai Hess <nicolaihess@gmail.com <mailto:nicolaihess@gmail.com>> wrote:
Some feedback on GTDebugger
- The inspector pane is great, we can inspect, evaluate code, and easily show/ inspect the code (for thisContext). although the evaluator pane has a bad text mode (for the thisContext).
Can you give me more details? Maybe it's obvious but I'm missing what's wrong :)
Hm, I can not reproduce it anymore.
Ok, now it happened again. See screenshot, the thisContext evaluator pane is wrong. And it does not go away (every debugger now shows this text, even if I debug a totally different method)
How to reporduce:
select some code and debugIt in the debugger select thisContex select the Evaluator pane, now select the Source pane close debugger open debugger again select Evaluator pane -> it will always show the last source pane text in the Evaluator pane
Cheers, Andrei
- I think the buttons are too small and the icon for "stop over" is misleading, it looks like a "step out" - the shortcuts (neither ctrl+t nor cmd+t) aren't working - I find it totally annoying and useless that the context pane inspector scrolls away if you select a value in the rightmost pane. The context inspector should be fixed. - I really miss the "List Methods using 'varname'/List Methods storing into 'varname' - the stacklist entry for block closures prints the block closure code, this is confusing (too much text for such a small widget).
nicolai
I like that you report bug and not me. Le 8/1/16 22:55, Nicolai Hess a écrit :
2016-01-08 22:48 GMT+01:00 Nicolai Hess <nicolaihess@gmail.com <mailto:nicolaihess@gmail.com>>:
2016-01-08 16:43 GMT+01:00 Andrei Chis <chisvasileandrei@gmail.com <mailto:chisvasileandrei@gmail.com>>:
Hi Nicolai,
Thanks for the feedback. Some issues I'll manage to fix until we integrate. For those that I do not manage please open bug reports.
On Thu, Jan 7, 2016 at 9:13 PM, Nicolai Hess <nicolaihess@gmail.com <mailto:nicolaihess@gmail.com>> wrote:
Some feedback on GTDebugger
- The inspector pane is great, we can inspect, evaluate code, and easily show/ inspect the code (for thisContext). although the evaluator pane has a bad text mode (for the thisContext).
Can you give me more details? Maybe it's obvious but I'm missing what's wrong :)
Hm, I can not reproduce it anymore.
Ok, now it happened again. See screenshot, the thisContext evaluator pane is wrong. And it does not go away (every debugger now shows this text, even if I debug a totally different method)
Cheers, Andrei
- I think the buttons are too small and the icon for "stop over" is misleading, it looks like a "step out" - the shortcuts (neither ctrl+t nor cmd+t) aren't working - I find it totally annoying and useless that the context pane inspector scrolls away if you select a value in the rightmost pane. The context inspector should be fixed. - I really miss the "List Methods using 'varname'/List Methods storing into 'varname' - the stacklist entry for block closures prints the block closure code, this is confusing (too much text for such a small widget).
nicolai
+1 Stef Le 7/1/16 21:13, Nicolai Hess a écrit :
Some feedback on GTDebugger
- The inspector pane is great, we can inspect, evaluate code, and easily show/ inspect the code (for thisContext). although the evaluator pane has a bad text mode (for the thisContext). - I think the buttons are too small and the icon for "stop over" is misleading, it looks like a "step out" - the shortcuts (neither ctrl+t nor cmd+t) aren't working - I find it totally annoying and useless that the context pane inspector scrolls away if you select a value in the rightmost pane. The context inspector should be fixed. - I really miss the "List Methods using 'varname'/List Methods storing into 'varname' - the stacklist entry for block closures prints the block closure code, this is confusing (too much text for such a small widget).
nicolai
participants (6)
-
 Andrei Chis
 -
 Esteban A. Maringolo
 -
 Esteban Lorenzano
 -
 Nicolai Hess
 -
 stepharo
 -
 Tudor Girba