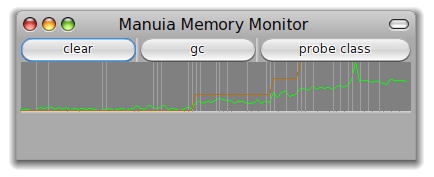
Hi! Between two latexing session, I did a 3 hours long coding session. I produced Manuia, a real-time memory monitor. I attached a screenshot to this email. You can try it by: Gofer new squeaksource: 'MetacelloRepository'; package: 'ConfigurationOfSpy'; load. (Smalltalk at: #ConfigurationOfSpy) perform: #loadDefault If you use a Pharo 1.1 then world menu/tools/Manuia Memory Monitor . Else, evaluate "ManuiaMonitor new open" Green curve is about the memory consumption: when it goes up, when you consuming memory. Vertical bars indicate that at least 10 incremental garbage collect was realized. There is a probe class button. Click on it, enter the name of a class, then you can see the evolution of the number of instances. It is just a small experiment I did. I haven't got the time to intensively use it. Feedbacks are very welcome. Cheers, Alexandre -- _,.;:~^~:;._,.;:~^~:;._,.;:~^~:;._,.;:~^~:;._,.;: Alexandre Bergel http://www.bergel.eu ^~:;._,.;:~^~:;._,.;:~^~:;._,.;:~^~:;._,.;:~^~:;.