[Pharo-project] Manuia Memory Monitor

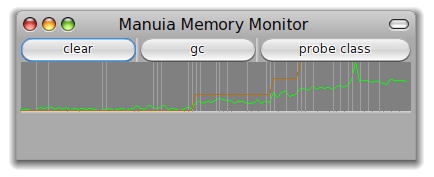
Hi! Between two latexing session, I did a 3 hours long coding session. I produced Manuia, a real-time memory monitor. I attached a screenshot to this email. You can try it by: Gofer new squeaksource: 'MetacelloRepository'; package: 'ConfigurationOfSpy'; load. (Smalltalk at: #ConfigurationOfSpy) perform: #loadDefault If you use a Pharo 1.1 then world menu/tools/Manuia Memory Monitor . Else, evaluate "ManuiaMonitor new open" Green curve is about the memory consumption: when it goes up, when you consuming memory. Vertical bars indicate that at least 10 incremental garbage collect was realized. There is a probe class button. Click on it, enter the name of a class, then you can see the evolution of the number of instances. It is just a small experiment I did. I haven't got the time to intensively use it. Feedbacks are very welcome. Cheers, Alexandre -- _,.;:~^~:;._,.;:~^~:;._,.;:~^~:;._,.;:~^~:;._,.;: Alexandre Bergel http://www.bergel.eu ^~:;._,.;:~^~:;._,.;:~^~:;._,.;:~^~:;._,.;:~^~:;.

Hi Alexandre. This is very interesting for me. I just test it a little. I am quite intrigued to know if the attached screenshots are normal. I just did nothing. I mean NOTHING in the image, while Manuia was running. I just left the mouse and keyboard doing nothing. First was picture 11 and then 13. Another question: what is the red curve in your screenshot? I don't have it. Thanks Mariano 2010/5/31 Alexandre Bergel <alexandre.bergel@inria.fr>
Hi!
Between two latexing session, I did a 3 hours long coding session. I produced Manuia, a real-time memory monitor. I attached a screenshot to this email. You can try it by:
Gofer new squeaksource: 'MetacelloRepository'; package: 'ConfigurationOfSpy'; load. (Smalltalk at: #ConfigurationOfSpy) perform: #loadDefault
If you use a Pharo 1.1 then world menu/tools/Manuia Memory Monitor . Else, evaluate "ManuiaMonitor new open" Green curve is about the memory consumption: when it goes up, when you consuming memory. Vertical bars indicate that at least 10 incremental garbage collect was realized.
There is a probe class button. Click on it, enter the name of a class, then you can see the evolution of the number of instances.
It is just a small experiment I did. I haven't got the time to intensively use it. Feedbacks are very welcome.
Cheers, Alexandre -- _,.;:~^~:;._,.;:~^~:;._,.;:~^~:;._,.;:~^~:;._,.;: Alexandre Bergel http://www.bergel.eu ^~:;._,.;:~^~:;._,.;:~^~:;._,.;:~^~:;._,.;:~^~:;.
_______________________________________________ Pharo-project mailing list Pharo-project@lists.gforge.inria.fr http://lists.gforge.inria.fr/cgi-bin/mailman/listinfo/pharo-project
Alexandre: Is there a way (or will be in a future) a way to script and customize it ? Suppose I want to trace several things, not only the amount of memory used. I would love to be able to define my own curves and have several at the same time. Maybe what I need is just that graph but totally customized for me. Any hints? Thanks in advance, Mariano On Mon, May 31, 2010 at 3:50 PM, Mariano Martinez Peck < marianopeck@gmail.com> wrote:
Hi Alexandre. This is very interesting for me.
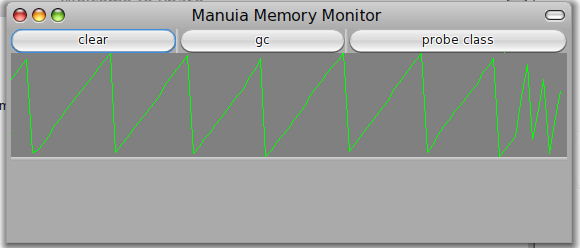
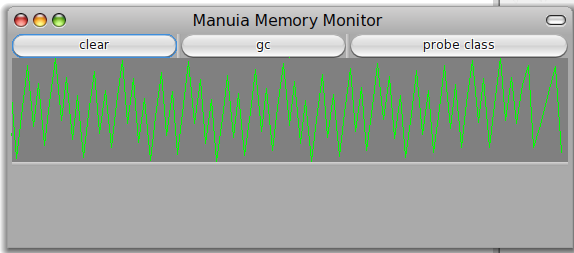
I just test it a little. I am quite intrigued to know if the attached screenshots are normal.
I just did nothing. I mean NOTHING in the image, while Manuia was running. I just left the mouse and keyboard doing nothing.
First was picture 11 and then 13.
Another question: what is the red curve in your screenshot? I don't have it.
Thanks
Mariano
2010/5/31 Alexandre Bergel <alexandre.bergel@inria.fr>
Hi!
Between two latexing session, I did a 3 hours long coding session. I produced Manuia, a real-time memory monitor. I attached a screenshot to this email. You can try it by:
Gofer new squeaksource: 'MetacelloRepository'; package: 'ConfigurationOfSpy'; load. (Smalltalk at: #ConfigurationOfSpy) perform: #loadDefault
If you use a Pharo 1.1 then world menu/tools/Manuia Memory Monitor . Else, evaluate "ManuiaMonitor new open" Green curve is about the memory consumption: when it goes up, when you consuming memory. Vertical bars indicate that at least 10 incremental garbage collect was realized.
There is a probe class button. Click on it, enter the name of a class, then you can see the evolution of the number of instances.
It is just a small experiment I did. I haven't got the time to intensively use it. Feedbacks are very welcome.
Cheers, Alexandre -- _,.;:~^~:;._,.;:~^~:;._,.;:~^~:;._,.;:~^~:;._,.;: Alexandre Bergel http://www.bergel.eu ^~:;._,.;:~^~:;._,.;:~^~:;._,.;:~^~:;._,.;:~^~:;.
_______________________________________________ Pharo-project mailing list Pharo-project@lists.gforge.inria.fr http://lists.gforge.inria.fr/cgi-bin/mailman/listinfo/pharo-project

On May 31, 2010, at 4:12 11PM, Mariano Martinez Peck wrote:
Alexandre: Is there a way (or will be in a future) a way to script and customize it ?
Suppose I want to trace several things, not only the amount of memory used. I would love to be able to define my own curves and have several at the same time.
Look at the code, it's quite simple. :) All you seem to have to do is subclass MMProbe, implement its interface (get current value, choosing a color, and potential custom rendering) and voila, you have a custom curve! Cheers, Henry
On May 31, 2010, at 4:38 14PM, Henrik Johansen wrote:
On May 31, 2010, at 4:12 11PM, Mariano Martinez Peck wrote:
Alexandre: Is there a way (or will be in a future) a way to script and customize it ?
Suppose I want to trace several things, not only the amount of memory used. I would love to be able to define my own curves and have several at the same time.
Look at the code, it's quite simple. :) All you seem to have to do is subclass MMProbe, implement its interface (get current value, choosing a color, and potential custom rendering) and voila, you have a custom curve!
Cheers, Henry
And of course, when looking a bit closer, it's even simpler :) (If you don't need custom display etc. that is) graph := MMGraph new. probe := MMProbe probleBlock: [:theProbe | theProbe addValue: someValueIWantACustomGraphFor]. graph addProbe: probe; openInWorld. not sure if probleBlock is a spelingError :) Cheers, Henry PS. Would it be possible to do: ManuiaMonitor>> initialize graph := MMGraph new. graph addProbe: MUsedMemoryProbe new; addProbe: MMGCProbe new. (and only window addMorph: graph in the open method) and remove self addProbe: MUsedMemoryProbe ... from MMGraph initialize? That way, a graph not used by the monitor is empty by default, and a new instance can be used for whatever graphing purpose one desires, like Mariano :)

And of course, when looking a bit closer, it's even simpler :) (If you don't need custom display etc. that is)
Making and keeping it simple is a strong requirement :-)
not sure if probleBlock is a spelingError :)
It is, indeed.
PS. Would it be possible to do: ManuiaMonitor>> initialize graph := MMGraph new. graph addProbe: MUsedMemoryProbe new; addProbe: MMGCProbe new.
Nicer yes.
That way, a graph not used by the monitor is empty by default, and a new instance can be used for whatever graphing purpose one desires, like Mariano :)
New version in the SqueakSource MemoryMonitor repository Cheers, Alexandre -- _,.;:~^~:;._,.;:~^~:;._,.;:~^~:;._,.;:~^~:;._,.;: Alexandre Bergel http://www.bergel.eu ^~:;._,.;:~^~:;._,.;:~^~:;._,.;:~^~:;._,.;:~^~:;.
On May 31, 2010, at 3:17 28PM, Alexandre Bergel wrote:
Hi!
Between two latexing session, I did a 3 hours long coding session. I produced Manuia, a real-time memory monitor. I attached a screenshot to this email. You can try it by:
Gofer new squeaksource: 'MetacelloRepository'; package: 'ConfigurationOfSpy'; load. (Smalltalk at: #ConfigurationOfSpy) perform: #loadDefault
If you use a Pharo 1.1 then world menu/tools/Manuia Memory Monitor . Else, evaluate "ManuiaMonitor new open" Green curve is about the memory consumption: when it goes up, when you consuming memory. Vertical bars indicate that at least 10 incremental garbage collect was realized.
There is a probe class button. Click on it, enter the name of a class, then you can see the evolution of the number of instances.
It is just a small experiment I did. I haven't got the time to intensively use it. Feedbacks are very welcome.
Cheers, Alexandre --
Works just fine not loading the entire Spy/Mondrian packages as well... Personally I'd really like to see something like this, combined with some of the textual data from Debug -> VM Statistics + Space left as a core tool. :) Cheers, Henry
Works just fine not loading the entire Spy/Mondrian packages as well...
Personally I'd really like to see something like this, combined with some of the textual data from Debug -> VM Statistics + Space left as a core tool. :)
Yep. Gofer new squeaksource: 'MemoryMonitor'; package: 'ConfigurationOfMemoryMonitor'; load. ((Smalltalk at: #ConfigurationOfMemoryMonitor) project perform: #lastVersion) load. It just loads 6 small classes. Accessible under the "World/Tools/Memory Monitor" menu item. Cheers, Alexandre -- _,.;:~^~:;._,.;:~^~:;._,.;:~^~:;._,.;:~^~:;._,.;: Alexandre Bergel http://www.bergel.eu ^~:;._,.;:~^~:;._,.;:~^~:;._,.;:~^~:;._,.;:~^~:;.
participants (4)
-
 Alexandre Bergel
 -
 Alexandre Bergel
 -
 Henrik Johansen
 -
 Mariano Martinez Peck