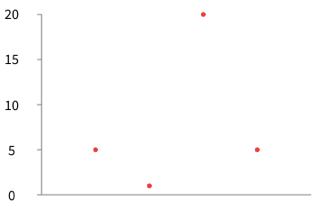
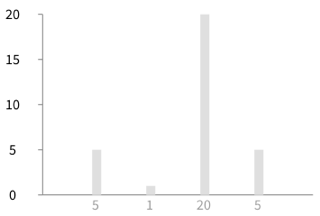
Hi Luc! This is something that is not really intuitive in Roassal. I am not sure whether this is a bug, but until now, we usually disable the labels on the X-axis. So, your script should be -=-=-=-=-=-=-=-=-=-=-=-= b := RTGrapher new. ds := RTStackedDataSet new. ds dotShape color: Color red. ds points: #(5 1 20 5). ds y: #yourself. b add: ds. b axisX noLabel; noTick. b axisY noDecimal. b -=-=-=-=-=-=-=-=-=-=-=-= If you need ticks and labels, you can simply do: -=-=-=-=-=-=-=-=-=-= b := RTGrapher new. ds := RTStackedDataSet new. ds barShape width: 10. ds barChartWithBarCenteredTitle: #yourself. ds points: #(5 1 20 5). ds y: #yourself. b add: ds. b axisX noLabel; noTick. b axisY noDecimal. b -=-=-=-=-=-=-=-=-=-= I hope this solves your problem. Cheers, Alexandre
On Jun 15, 2015, at 6:20 PM, Luc Fabresse <luc.fabresse@gmail.com> wrote:
Hi,
The doc here [1] says: "Data points may be stacked, meaning that the index of the point in the collection is its X value."
When I use the same example as in the doc but with labels and ticks:
b := RTGrapher new. ds := RTStackedDataSet new. ds dotShape color: Color red. ds points: #(5 1 20 5). ds y: #yourself. b add: ds. b axisX noDecimal. b axisY noDecimal. b build. b view inspect
it seems that y values are not aligned on x ones (i.e. I would expect the first red point to be 1@5). Is it a bug or did I misunderstood something?
<Screen Shot 2015-06-15 at 23.18.36.png>
[1] https://dl.dropboxusercontent.com/u/31543901/AgileVisualization/Grapher/0202...
Thanks,
#Luc
-- _,.;:~^~:;._,.;:~^~:;._,.;:~^~:;._,.;:~^~:;._,.;: Alexandre Bergel http://www.bergel.eu ^~:;._,.;:~^~:;._,.;:~^~:;._,.;:~^~:;._,.;:~^~:;.