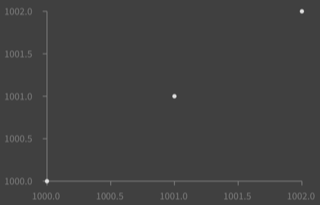
Hi Evan, Roassal assumes to have 0 @ 0. However, you do a manual translation that works very well. Check this: -=-=-=-=-=-=-=-=-=-=-=-=https://www.dropbox.com/s/oun1w85ypv1kbka/Screenshot%202017-12-19%2015.02.07... data := #(1000 1001 1002). b := RTGrapher new. ds := RTData new. ds points: data. ds x: [ :c | c - 1000]. ds y: [ :c | c - 1000 ]. b add: ds. b axisX labelConversion: [ :v | (v + 1000) asFloat ]. b axisY labelConversion: [ :v | (v + 1000) asFloat ]. b. -=-=-=-=-=-=-=-=-=-=-=-= The idea is to subtract a value using #x: and #y:, and then add it in #labelConversion: Let us know how it goes -- _,.;:~^~:;._,.;:~^~:;._,.;:~^~:;._,.;:~^~:;._,.;: Alexandre Bergel http://www.bergel.eu ^~:;._,.;:~^~:;._,.;:~^~:;._,.;:~^~:;._,.;:~^~:;.
On Dec 19, 2017, at 12:44 PM, Evan Donahue <emdonahu@gmail.com> wrote:
Does anyone know how to change the min/max of the axes? I'm trying to figure out how to make x and y not start at 0.
data := #(1000 1001 1002). b := RTGrapher new. ds := RTData new. ds points: data. ds x: [ :c | c ]. ds y: [ :c | c ]. b add: ds. b minX: 999. b maxX: 1003. b minY: 999. b maxY: 1003. b.
^ this does not do what I was expecting. If the data is all clustered together but far from zero, I'd like to adjust the axes so I can see the actual variation in the data, and not just a single point where everything is clustered. What is the right way to do this?
Thanks, Evan