Sept. 18, 2015
5:43 p.m.
Le 18/09/2015 17:33, Hilaire a écrit :
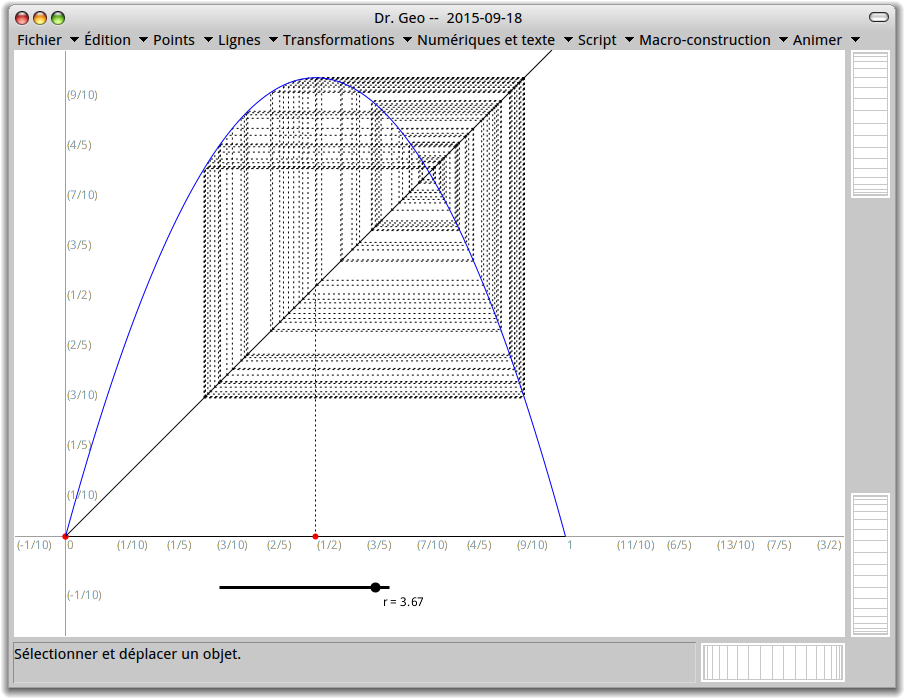
It should be possible to build graphic view seen in the wikipedia page bellow. Ah, I can't resist to write a model for a cobweb diagram of the sequence. The graph below shows the chaotic behaviour with the first 100 terms of the sequence when parameter is around 3.6. I should make a footage of it :)
Hilaire -- Dr. Geo http://drgeo.eu http://google.com/+DrgeoEu