On Fri, Sep 16, 2016 at 3:02 PM, Thierry Goubier <thierry.goubier@gmail.com> wrote:
2016-09-16 8:54 GMT+02:00 stepharo <stepharo@free.fr>:
Furthermore, typical examples require more than one liners, and these should be factored out separately.
I really like the one liners that you can find im some method comments, like in Color class>>#wheel: if you are new to pharo and start exploring the system, it makes fun to see these little one lines and just execute it. (even if they aren't onelines like in some method in class Form).
Me too and what I like is that there are coupled to the method. I find a method and I guess it will help me and bam I read the example and I'm sure it is or not what I'm looking for.
My belief is that we have an IDE able to track metadata (here, examples) along with methods, and that there is no need to play with syntax extensions (which are a way of adding metadata to programming languages stuck in the file concept of the 60's).
In short, a nice, OO way of adding information about a method / class / tag / package that the IDE knows how to relate to the code.
Having the class comment pane open in Nautilus is already a step towards doing that.
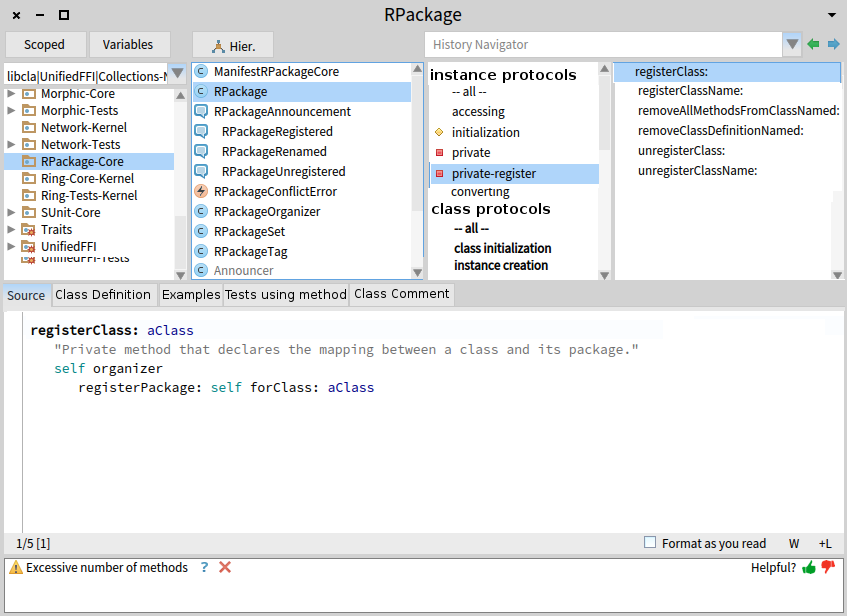
So another way to look at keeping example/tests close to the methods is for the Browser code pane to have tabs [Source] [Examples] [Tests] [Class Comment] where maybe [Tests] lists every test containing the selection from the method pane. Adding these same to GTDebugger (which already has a [Source] tab) would improve inter-tool consistency. Spare vertical space for the code-pane tabs might be obtained if the <claass> button is replaced by a class/instance treeview protocol-pane tree view, then <Class> button goes away, the <Hier.> button could move above the class-pane leaving a spare row for the code pane tabs to sit. Attached is a rough mockup. cheers -ben