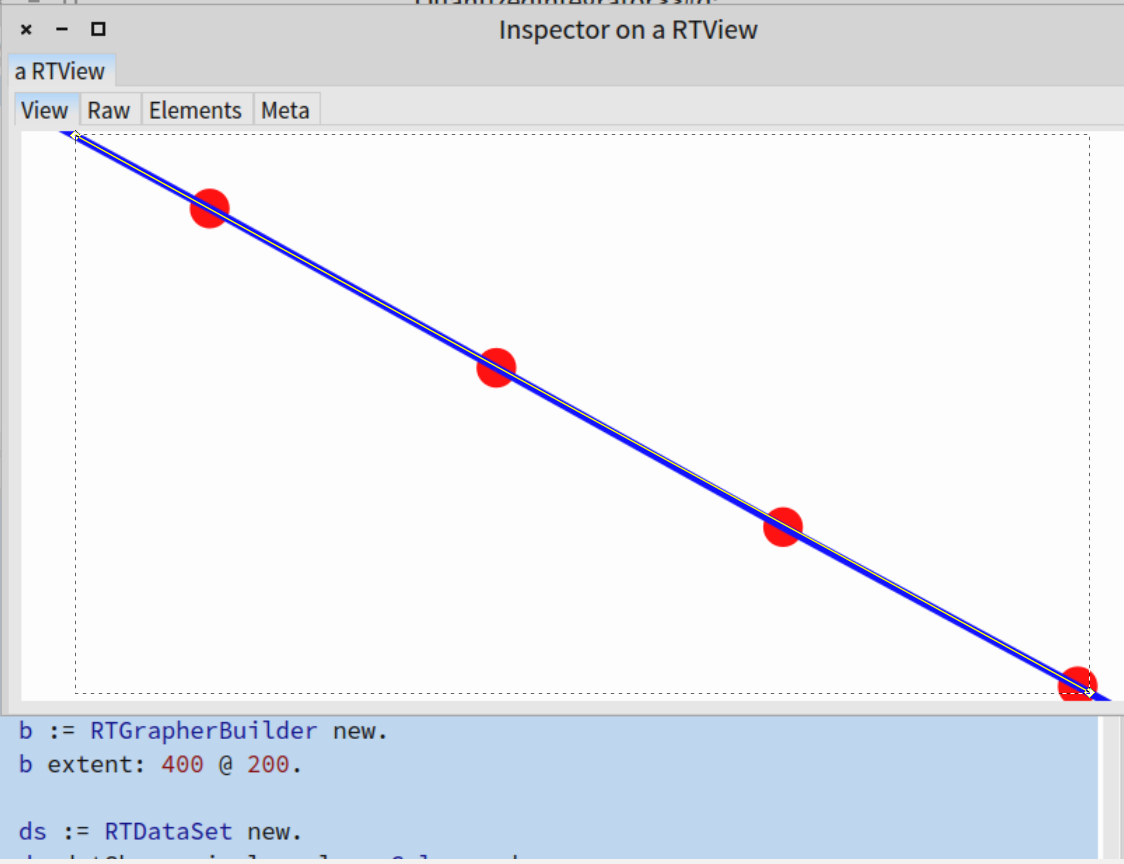
Hi guys, I'm drawing a chart with roassal2 and just discovered that lines are not being drawn exactly as expected. Maybe this is a known problem? I'm running on a few months old pharo4beta image, in linux. Here I attach a screenshot corresponding to the code below. There are more evident examples but this one is easier to debug as it is a straight line made of many segments (zooming a bit you'll see the thin reference line and notice the blue line "bends"). Thanks for reading! Cheers, Javier test | b ds events | events := { 10.0 @ 1.0. 9.0 @ 2.0. 8.0 @ 3.0. 7.0 @ 4.0. 6.0 @ 5.0. 5.0 @ 6.0. 4.0 @ 7.0. 3.0 @ 8.0. 2.0 @ 9.0. 1.0 @ 10.0. 0.0 @ 11.0}. b := RTGrapherBuilder new. b extent: 400 @ 200. ds := RTDataSet new. ds dotShape circle color: Color red. ds interaction fixedPopupText: [ :e | e printString ]. ds points: events. ds connectColor: Color blue. ds x: [ :e | e y ]. ds y: [ :e | e x ]. b add: ds. b axisXWithNumberOfTicks: events size. ^b build [image: Inline image 1] -- Javier Pimás Ciudad de Buenos Aires