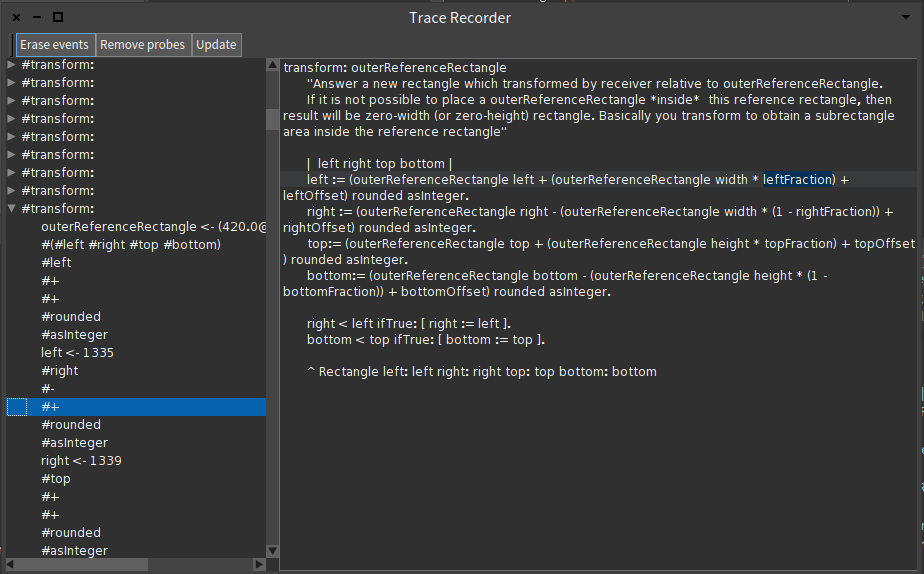
Hi Florin, you're in for some interesting questions :) First, I did not have a methodology for finding the issue (or explaining the algorithm) when I started, and I didn't have one afterwards; you need to look into the WhyLine stuff for that (they do a lot better, but I don't have the time to reimplement their tool). But I noticed that understanding an algorithm is easy (relatively) when: - You can easily move repeatedly to any point in an execution stream of that algorithm (i.e. ubiquitous debugging: step forward, backward, jump at any point back and forth, any number of times). - At each point, you are given the precise point in the source code (debugger-like) - At each point, you get significant values: assignments, arguments, return values Representation is easy: an execution is a tree. A sequence in this execution is items at the same level in the tree. Calls are subtrees, as well as iterations. Gui is simple: a tree on the left, code pane on the right. See an example underway: I'm trying to find a bug in LayoutFrame, so I traced LayoutFrame>>transform: (without breaking Morphic). [image: Images intégrées 1] This is for exploration at the moment, and not comparing values. And on a single method, and highlighting is broken in Pharo 4 :( In the value tracking idea, what we thought then in the place I worked in at that time, is that we could study comparing / diffing trace trees to see where the two versions of the algorithm diverges. We didn't follow up and it wasn't published. I have new visualisations on Roassal now, but they are for static analysis of multitask C code. Does that give you ideas? Thierry 2014-10-06 15:08 GMT+02:00 Florin Mateoc <fmateoc@gmail.com>:
Hi Thierry,
On 10/4/2014 5:32 PM, Thierry Goubier wrote:
I do have specific tools I can use in such circumstances that you don't have.
What kind of tools? I would be interested in learning about them and the analysis use cases they support.
I have a trace tool for those situations (and also for parser work).
What trace tool? Is an example available?
http://lists.gforge.inria.fr/pipermail/pharo-project/2012-July/067679.html
My original use case was: - Finding the bug in an error correction decoding algorithm which worked without error, but with non-satisfying results: lower than expected SNR. - Has then been used very successfully to explain the algorithm. - Was then used as the basis for a hardware design methodology by dynamic code traces of multithreaded programs
I am very interested in the "explaining the algorithm" aspect of your tool. Could you please talk a little about that?
I think I had a similar use case - improving an algorithm working over a lot of data (so stepping through it with a debugger was unrealistic) - and my approach was to run two versions in parallel (the latest (best) available iteration in the implementation, known to work, versus the bleeding edge), with synchronization points for every iteration within the algorithm execution, so that I would catch (through a halt) any divergence as soon as it started, and from them on using the debugger. This worked quite well, but it did not help with explaining the working of the algorithm and I kept wishing I had a visualization that would help me get to an intuitive (and holistic, not just of the subparts) understanding of how the algorithm worked (in the style of Bret Victor's visualizations), but I did not know how to get to it. So, if you did manage to get to such a visualization (one that does not come from an already (pre-existing for the creator of the visualization) understanding of the algorithm), that would be fantastic
Florin