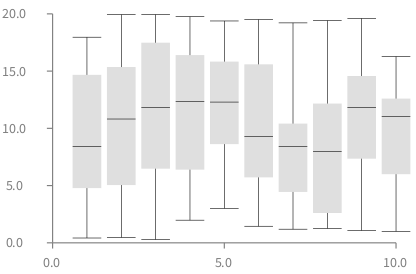
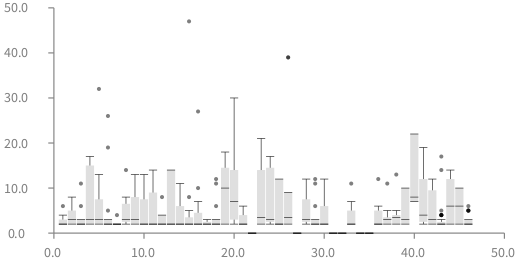
Thank you , Alexandre. That's exactly what I needed to know. Adapting the whisker plots should be straightforward. Shaping From: Alexandre Bergel [mailto:alexandre.bergel@me.com] Sent: Tuesday, July 31, 2018 3:47 PM To: Pharo Development List <pharo-dev@lists.pharo.org> Cc: Any question about pharo is welcome <pharo-users@lists.pharo.org> Subject: Re: [Pharo-dev] Charting in Roassal2 Hi! Roassal supports Whisker plots, but not exactly candlestick. You can try this: -=-=-=-=-=-=-=-=-=-=-=-= | b createList r | r := Random new. createList := [ :size :d1 :d2 | (1 to: size) collect: [ :i | d1 + (r next * (d2-d1))] ]. b := RTGrapher new. (1 to: 10) do: [ :i | | ds | ds := RTBoxPlotDataSet new. ds points: (createList value: 20 value: 0 value: 20). b add: ds.]. b -=-=-=-=-=-=-=-=-=-=-=-= Which produces: Another example: =-=-==-=-==-=-==-=-==-=-==-=-==-=-==-=-==-=-==-=-= | b ds | b := RTGrapher new. b extent: 400 @ 200. RTShape withAllSubclasses do: [ :cls | ds := RTBoxPlotDataSet new. ds points: (cls rtmethods collect: #numberOfLinesOfCode). b add: ds ]. ^ b =-=-==-=-==-=-==-=-==-=-==-=-==-=-==-=-==-=-==-=-= Which shows the distribution of methods size in Roassal Cheers, Alexandre -- _,.;:~^~:;._,.;:~^~:;._,.;:~^~:;._,.;:~^~:;._,.;: Alexandre Bergel http://www.bergel.eu ^~:;._,.;:~^~:;._,.;:~^~:;._,.;:~^~:;._,.;:~^~:;. On Jul 27, 2018, at 8:47 PM, Shaping <shaping@uurda.org <mailto:shaping@uurda.org> > wrote: Hi Folks. Can anyone tell me whether we have candlestick-charting ability in Roassal2? Shaping