
Hi guys During the DSU workshop we were brainstorming about what are the most difficult bugs we faced and what are the conceptual tools that would have helped you. Stef

For me it was when I was making the CPP library. CPP for those that do not know is a library I made that allows Pharo to control a C++ application. Its a very simple IPC bridge using shared memory mapped files. I was surprised how easy it was to make it from the C++ side Pharo side was a different story. UFFI is brilliantly simple to use BUT, as much as the Pharo rocks for debugging Pharo code it works under one caveat. The caveat being that your code makes no usage of UFFI or any FFI. Because the Pharo debugger has no means to debug UFFI. People may not realize it but practically UFFI is C coding. It make look like your usual Pharo code but make no mistake its C all the way. So the practice is to make sure the code works in C first. However if it works in C but for some strange reason it makes Pharo freak out you are all by yourself. Pharo code that can crash Pharo is the one that needs debugging the most. So to find these bug which fortunately there were not many I had to crash Pharo countless times and move extremely slow and step by step. None the less I success was the final result and I learned a ton in the process. On Thu, Mar 9, 2017 at 1:38 PM Stephane Ducasse <stepharo.self@gmail.com> wrote:
Hi guys
During the DSU workshop we were brainstorming about what are the most difficult bugs we faced and what are the conceptual tools that would have helped you.
Stef

2017-03-09 12:36 GMT+01:00 Stephane Ducasse <stepharo.self@gmail.com>:
Hi guys
During the DSU workshop we were brainstorming about what are the most difficult bugs we faced and what are the conceptual tools that would have helped you.
Stef
https://pharo.fogbugz.com/f/cases/14332/use-ast-not-parseTree-so-we-benefit-... Running a RBLintRule modified the (cached) AST of this methods code. So, even if the compiled method did not changed, and the "real" source code did not changed, you actually see the source code from the modified AST. There are a couple of things which went wrong resp. make this bug difficult: 1. A LintRule that just should *check* the code, actually created a transformation somewhere behind the scene (Ok, it is a RBTransformationRule, and originally used for code refactoring as well) 2. As long as we *analyze* code, the real code (string/ast/source) should be considered immutable 3. the modified AST was cached 4. what-you-see-is-not-what-you-get. We are (or I am) used to consider the system browser a tool for view and edit methods source code. If the code we see isn't actually the methods source, but another representation of some kind of (cached) model (formatted AST-node-source code), it would be good to have some way to indicate this (switch between "raw"-code / model-code / ast-node-code).

Fixing a race condition in handling open sockets when forking an image. At first I had no clue where the problem could come from, then I spent a lot of time guessing at the conditions (of course, being a race condition there was no means to force the specific condition but I didn't know that yet). Over all I spent about 6 weeks on this bug and finally fixed it by creating a new primitive to handle that specific case. I'm not sure what tools could have helped me as this was a rather specific problem (OSProcess). But the hardest problems in my experience are usually concurrency / asynchrony (e.g. race conditions) or bugs in libraries (where you always assume that you must have made a mistake, never the library). Max
On 9 Mar 2017, at 12:36, Stephane Ducasse <stepharo.self@gmail.com> wrote:
Hi guys
During the DSU workshop we were brainstorming about what are the most difficult bugs we faced and what are the conceptual tools that would have helped you.
Stef

I don't think my reply will be anything useful, but as to me the most craziest bug is metabug, i.e. when system doesn't provides any means to debug things. :) As for regular bugs .. it is quite hard to remember anything i wasn't able to deal with, given enough time & effort, and then emphasize single case over the rest. And since human brains tend to forget unpleasant things, there's not much details to tell and remember. On 9 March 2017 at 13:36, Stephane Ducasse <stepharo.self@gmail.com> wrote:
Hi guys
During the DSU workshop we were brainstorming about what are the most difficult bugs we faced and what are the conceptual tools that would have helped you.
Stef
-- Best regards, Igor Stasenko.

Thanks you all. The idea is that we want to see how we cn improve our debugging arsenal. So it is important that your scenario give use some hints. It is difficult to convey what we are really looking for :)
Hi guys
During the DSU workshop we were brainstorming about what are the most difficult bugs we faced and what are the conceptual tools that would have helped you.
Stef
-- Using Opera's mail client: http://www.opera.com/mail/

Stef, One of the things that I do all of the time when trying to debug particularly difficult problems is to keep a "bug notebook". My "bug notebook" is a text file where I record information gleaned from an inspector intermixed with comments, code and observations... I've attached an example from a couple of days ago (bug_notebook.txt). The particular problem I am working on involves btree nodes being improperly updated during index object updates. Each btree node is basically a 2000+ element Array ... so there is a lot of data to deal with . In the notebook, I extract the interesting entries from the btree node and record the original set of values and then record the updated set of values and in this particular case I was able to "see" that after the update I had 4 entries that were not properly deleted ... In addition to recording the interesting chunks of large data structures, I often end up with chunks of stacks from the debugger, copies of a inspector panes in my "bug notebooks" and chunks of code ... Over the last several weeks I have been tackling different sets of bugs in this same area and I have been keeping a time-stamped log of the work that I've done along the way (analysis_notebook.txt) ... in this notebook I've bee recording test results and branch/SHA information so that I can easily reference different versions of methods as I work through fixing bugs and managing regressions ... There's a section in the notebook where I've record performance information, so that when I have finished work on this set of bugs, I can evaluate how I've impacted performance ... Finally at the very bottom of the notebook, I've recorded a simple todo-list ... The notebooks are on a shared disk so that I can access and update the "bug notebook" when I am working from home on a mac or at work from a linux box ... I rely on the fact that I am working with text and not images ... since I like to copy and paste as well as search for particular strings in the data from the inspector ... in the bug_notebook I searched for the `victim` string in the text output from an inspector ... I have come to really depend upon bug notebooks when addressing difficult bugs and I think that support for creating and maintaining bug notebooks would be a valuable addition the the debugging arsenal... Dale On 03/09/2017 10:50 AM, stepharong wrote:
Thanks you all.
The idea is that we want to see how we cn improve our debugging arsenal. So it is important that your scenario give use some hints. It is difficult to convey what we are really looking for :)
Hi guys
During the DSU workshop we were brainstorming about what are the most difficult bugs we faced and what are the conceptual tools that would have helped you.
Stef
-- Using Opera's mail client: http://www.opera.com/mail/
nice ideas!
Stef,
One of the things that I do all of the time when trying to debug particularly difficult problems is to keep a "bug notebook". My "bug notebook" is a text file where I record >information gleaned from an inspector intermixed with comments, code and observations...
I've attached an example from a couple of days ago (bug_notebook.txt). The particular problem I am working on involves btree nodes being improperly updated during index object updates. Each btree node is basically a 2000+ element Array ... so >there is a lot of data to deal with . In the notebook, I extract the interesting entries from the btree node and record the original set of values and then record the updated set of values and in this particular case I >was able to "see" that after the update I had 4 entries that were not properly deleted ... In addition to recording the interesting chunks of large data structures, I often end up with chunks of stacks from the debugger, copies of a inspector panes in my "bug >notebooks" and chunks of code ...
Over the last several weeks I have been tackling different sets of bugs in this same area and I have been keeping a time-stamped log of the work that I've done along the way >(analysis_notebook.txt) ... in this notebook I've bee recording test results and branch/SHA information so that I can easily reference different versions of methods as I work
through fixing bugs and managing regressions ... There's a section in the notebook where I've record performance information, so that when I have finished work on this set of >bugs, I can evaluate how I've impacted performance ... Finally at the very bottom of the notebook, I've recorded a simple todo-list ... The notebooks are on a shared disk so that I can access and update the "bug notebook" when I am working from home on a mac or at work from a linux box ... I rely on the fact that I am working with text and not images ... since I like to copy and paste as well as search for particular strings in the data from the inspector ... in the >bug_notebook I searched for the `victim` string in the text output from an inspector ...
I have come to really depend upon bug notebooks when addressing difficult bugs and I think that support for creating and maintaining bug notebooks would be a valuable >addition the the debugging arsenal...
Dale
On 03/09/2017 10:50 AM, stepharong wrote:
Thanks you all.
The idea is that we want to see how we cn improve our debugging arsenal. So it is important that your scenario give use some hints.It is difficult to convey what we are really looking for :)
Hi guys During the DSU workshop we were brainstorming about what are the most difficult bugs we faced and what are the conceptual tools that would have helped >>>you.
Stef
--Using Opera's mail client: http://www.opera.com/mail/
-- Using Opera's mail client: http://www.opera.com/mail/
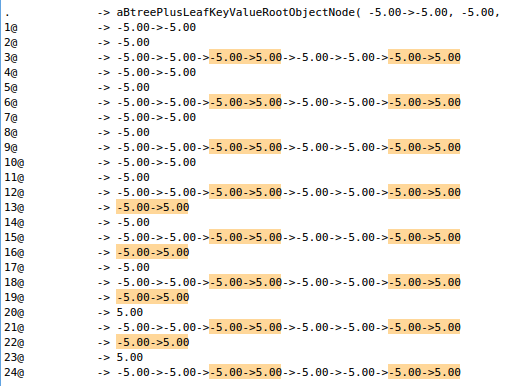
The attached screnshot illustrates why I like having text instead of pngs ... being able to highlight the association value (-5.00->5.00) is very useful when identifying the entries in a btree associated with the association (the entries at 13, 16,19, and 22)... On 03/09/2017 11:34 AM, Dale Henrichs wrote:
Stef,
One of the things that I do all of the time when trying to debug particularly difficult problems is to keep a "bug notebook". My "bug notebook" is a text file where I record information gleaned from an inspector intermixed with comments, code and observations...
I've attached an example from a couple of days ago (bug_notebook.txt).
The particular problem I am working on involves btree nodes being improperly updated during index object updates. Each btree node is basically a 2000+ element Array ... so there is a lot of data to deal with .
In the notebook, I extract the interesting entries from the btree node and record the original set of values and then record the updated set of values and in this particular case I was able to "see" that after the update I had 4 entries that were not properly deleted ...
In addition to recording the interesting chunks of large data structures, I often end up with chunks of stacks from the debugger, copies of a inspector panes in my "bug notebooks" and chunks of code ...
Over the last several weeks I have been tackling different sets of bugs in this same area and I have been keeping a time-stamped log of the work that I've done along the way (analysis_notebook.txt) ... in this notebook I've bee recording test results and branch/SHA information so that I can easily reference different versions of methods as I work through fixing bugs and managing regressions ... There's a section in the notebook where I've record performance information, so that when I have finished work on this set of bugs, I can evaluate how I've impacted performance ... Finally at the very bottom of the notebook, I've recorded a simple todo-list ...
The notebooks are on a shared disk so that I can access and update the "bug notebook" when I am working from home on a mac or at work from a linux box ...
I rely on the fact that I am working with text and not images ... since I like to copy and paste as well as search for particular strings in the data from the inspector ... in the bug_notebook I searched for the `victim` string in the text output from an inspector ...
I have come to really depend upon bug notebooks when addressing difficult bugs and I think that support for creating and maintaining bug notebooks would be a valuable addition the the debugging arsenal...
Dale
On 03/09/2017 10:50 AM, stepharong wrote:
Thanks you all.
The idea is that we want to see how we cn improve our debugging arsenal. So it is important that your scenario give use some hints. It is difficult to convey what we are really looking for :)
Hi guys
During the DSU workshop we were brainstorming about what are the most difficult bugs we faced and what are the conceptual tools that would have helped you.
Stef
-- Using Opera's mail client: http://www.opera.com/mail/
I understand well your point :) On Thu, 09 Mar 2017 21:30:21 +0100, Dale Henrichs <dale.henrichs@gemtalksystems.com> wrote:
The attached screnshot illustrates why I like having text instead of pngs ... being able to highlight the association value (-5.00->5.00) is very useful when identifying the entries >in a btree associated with the association (the entries at 13, 16,19, and 22)...
On 03/09/2017 11:34 AM, Dale Henrichs wrote:
Stef,
One of the things that I do all of the time when trying to debug particularly difficult problems is to keep a "bug notebook". My "bug notebook" is a text file where I >>record information gleaned from an inspector intermixed with comments, code and observations...
I've attached an example from a couple of days ago (bug_notebook.txt). The particular problem I am working on involves btree nodes being improperly updated during index object updates. Each btree node is basically a 2000+ >>element Array ... so there is a lot of data to deal with . In the notebook, I extract the interesting entries from the btree node and record the original set of values and then record the updated set of values and in this >>particular case I was able to "see" that after the update I had 4 entries that were not properly deleted ... In addition to recording the interesting chunks of large data structures, I often end up with chunks of stacks from the debugger, copies of a inspector panes in my >>"bug notebooks" and chunks of code ...
Over the last several weeks I have been tackling different sets of bugs in this same area and I have been keeping a time-stamped log of the work that I've done >>along the way (analysis_notebook.txt) ... in this notebook I've bee recording test results and branch/SHA information so that I can easily reference different >>versions of methods as I work through fixing bugs and managing regressions ... There's a section in the notebook where I've record performance information, so >>that when I have finished work on this set of bugs, I can evaluate how I've impacted performance ... Finally at the very bottom of the notebook, I've recorded a >>simple todo-list ... The notebooks are on a shared disk so that I can access and update the "bug notebook" when I am working from home on a mac or at work from a linux box ... I rely on the fact that I am working with text and not images ... since I like to copy and paste as well as search for particular strings in the data from the inspector ... >>in the bug_notebook I searched for the `victim` string in the text output from an inspector ...
I have come to really depend upon bug notebooks when addressing difficult bugs and I think that support for creating and maintaining bug notebooks would be a >>valuable addition the the debugging arsenal...
Dale
On 03/09/2017 10:50 AM, stepharong wrote:
Thanks you all.
The idea is that we want to see how we cn improve our debugging arsenal.So it is important that your scenario give use some hints.It is difficult to convey what we are really looking for :)
Hi guys During the DSU workshop we were brainstorming about what are the most difficult bugs we faced and what are the conceptual tools that would
have helped you.
Stef
--Using Opera's mail client: http://www.opera.com/mail/
-- Using Opera's mail client: http://www.opera.com/mail/

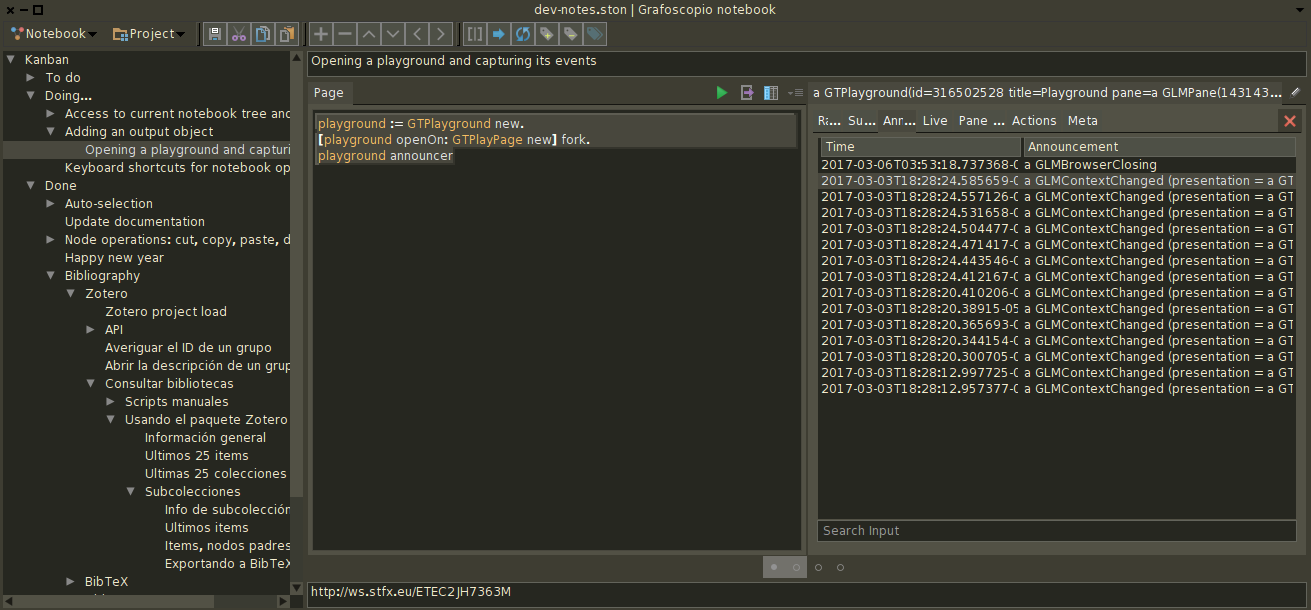
Hi, On the issue of developers log/notebook, I also have mine about Grafoscopio and other ideas (which is, of course, an interactive notebook, made in Grafoscopio). That allows me to take notes and trying to reproduce stuff that is not yet into the system as part of a package or create a story and different contextual information about my dev process to communicate it to another people. Here is an screenshot of how it looks: I have attached the notebook in ston format also :-). Cheers, Offray On 09/03/17 14:34, Dale Henrichs wrote:
Stef,
One of the things that I do all of the time when trying to debug particularly difficult problems is to keep a "bug notebook". My "bug notebook" is a text file where I record information gleaned from an inspector intermixed with comments, code and observations...
I've attached an example from a couple of days ago (bug_notebook.txt).
The particular problem I am working on involves btree nodes being improperly updated during index object updates. Each btree node is basically a 2000+ element Array ... so there is a lot of data to deal with .
In the notebook, I extract the interesting entries from the btree node and record the original set of values and then record the updated set of values and in this particular case I was able to "see" that after the update I had 4 entries that were not properly deleted ...
In addition to recording the interesting chunks of large data structures, I often end up with chunks of stacks from the debugger, copies of a inspector panes in my "bug notebooks" and chunks of code ...
Over the last several weeks I have been tackling different sets of bugs in this same area and I have been keeping a time-stamped log of the work that I've done along the way (analysis_notebook.txt) ... in this notebook I've bee recording test results and branch/SHA information so that I can easily reference different versions of methods as I work through fixing bugs and managing regressions ... There's a section in the notebook where I've record performance information, so that when I have finished work on this set of bugs, I can evaluate how I've impacted performance ... Finally at the very bottom of the notebook, I've recorded a simple todo-list ...
The notebooks are on a shared disk so that I can access and update the "bug notebook" when I am working from home on a mac or at work from a linux box ...
I rely on the fact that I am working with text and not images ... since I like to copy and paste as well as search for particular strings in the data from the inspector ... in the bug_notebook I searched for the `victim` string in the text output from an inspector ...
I have come to really depend upon bug notebooks when addressing difficult bugs and I think that support for creating and maintaining bug notebooks would be a valuable addition the the debugging arsenal...
Dale
On 03/09/2017 10:50 AM, stepharong wrote:
Thanks you all.
The idea is that we want to see how we cn improve our debugging arsenal. So it is important that your scenario give use some hints. It is difficult to convey what we are really looking for :)
Hi guys
During the DSU workshop we were brainstorming about what are the most difficult bugs we faced and what are the conceptual tools that would have helped you.
Stef
-- Using Opera's mail client: http://www.opera.com/mail/

On 9 Mar 2017, at 12:36, Stephane Ducasse <stepharo.self@gmail.com> wrote:
Hi guys
During the DSU workshop we were brainstorming about what are the most difficult bugs we faced and what are the conceptual tools that would have helped you.
Tracking down a problem where a header file was like this struct touch_screen_event { #ifdef SOME_FLAG ... other fields #endif int x; int y; int pressure; }; The touchscreen library was compile with -DSOME_FLAG but the code using that library didn't have the flag set. This means the code using the touchscreen events read x/y from the wrong offset in memory. The example work of the touchscreen library worked while the real user didn't. It would have helped to embed struct sizes and offsets into the shared library to find differences at link time. --- Keyboard handling in kdrive (an Xserver for embedded/mobile usage): After plugging/unplugging USB into the device, the keyboard started to generate wrong keycodes. In Linux (depending on your keyboard mode) every key event is represented as a byte(?). This worked for a long time but then keyboards started to have more keys. So a special key value is used to indicate that a multi byte sequence will follow. As it turns out plugging/unplugging generated a multi-byte keyboard event... Not sure what would have helped? :)

My worst bug(s) is(are) related to the TopLink ORM. In one particular case, we were working on a *huge* system and different "modules" were assigned to different teams. Every module was working perfectly by itself (as confirmed by the SUnit testing) but sometimes, the database would get out of whack. I finally realized that depending on the classes you used to perform object deletion (we had a parent-children-familymembers kinda model), none of the "modules" did it the same way and they all differed when it came to access the to-be-deleted object. Most classes accessed the same "kind" of object from a single access point but not all of them! That did create interesting problems where the to-be-deleted object reappeared in the database with old values, or just vanished during some operation only to reappear afterwards... Besides, debugging proxies and cached objects is a real pain in the *ss ! And in many cases, you can't ever log properly anything as it would instantiate the proxies! So I ended up not trusting the Smalltalk side of things and worked my way out from DB/2 logging only!   ----------------- Benoît St-Jean Yahoo! Messenger: bstjean Twitter: @BenLeChialeux Pinterest: benoitstjean Instagram: Chef_Benito IRC: lamneth Blogue: endormitoire.wordpress.com "A standpoint is an intellectual horizon of radius zero". (A. Einstein)

I actually have a whole class of bugs and elements of a very Pharo-y solution. I do a lot of work in a logic programming framework. Being a logic programming framework, it does not execute the code you write in a start-to-finish manner, but executes a few lines here, then jumps around and executes a few lines there. As a result, if you are trying to trace the evolution of a particular branch in the search tree, you can only follow one or two operations at a time in the debugger, then that branch gets put in the queue and you may have to step through tens or hundreds of other searches before you get back to it (if you can even recognize which branch you were following when it comes around again). This makes debugging basically impossible in every other language this framework has been ported to, and the standard strategy is just to stare at the code. Pharo's debugger was already a step up, but it still wasn't nearly up to the task. I had been trying to get a particularly complex program to work for several days with no success, at which point I decided to investigate the moldable debugger framework. It took me several more days of going through the debugger code in different versions and emailing with its developers to get something working, which just speaks to the state that framework and documentation happened to be in at the time, but when I did get it working I found the bug in a few minutes. I essentially set up a visual depiction of the search tree where I could click on a branch and have the framework run until that branch came up again to the front of the queue. This meant I could trace execution linearly by giving myself a way to get a handle on the control flow via a visual interface. I have since changed my framework and broken the debugger code, but I definitely intend to try to get that rigged up again when the logic system is in a more polished form. Admittedly, many programs probably do not have the problem that their control flow is so complex that a normal linear debugger is too difficult to understand, but on some level the ability to specify a debugging control flow outside the execution of the program itself seems like a pretty powerful idea, and something Pharo should be very well suited for with its interactivity/reflectivity. Maybe there would be more complex, logic-based programs if they weren't so hard to write! Evan -- View this message in context: http://forum.world.st/What-is-the-craziest-bug-you-ever-face-tp4937984p49380... Sent from the Pharo Smalltalk Users mailing list archive at Nabble.com.
I should add that users of the logic framework from non-smalltalk languages were very impressed by the potential. Evan -- View this message in context: http://forum.world.st/What-is-the-craziest-bug-you-ever-face-tp4937984p49380... Sent from the Pharo Smalltalk Users mailing list archive at Nabble.com.
On Thu, 09 Mar 2017 20:53:48 +0100, Evan Donahue <emdonahu@gmail.com> wrote:
I actually have a whole class of bugs and elements of a very Pharo-y solution.
I do a lot of work in a logic programming framework. Being a logic programming framework, it does not execute the code you write in a start-to-finish manner, but executes a few lines here, then jumps around and executes a few lines there. As a result, if you are trying to trace the evolution of a particular branch in the search tree, you can only follow one or two operations at a time in the debugger, then that branch gets put in the queue and you may have to step through tens or hundreds of other searches before you get back to it (if you can even recognize which branch you were following when it comes around again). This makes debugging basically impossible in every other language this framework has been ported to, and the standard strategy is just to stare at the code. Pharo's debugger was already a step up, but it still wasn't nearly up to the task.
did you think about adapting the debugger to your execution semantics? ... I read that you did it Excellent!
I had been trying to get a particularly complex program to work for several days with no success, at which point I decided to investigate the moldable debugger framework. It took me several more days of going through the debugger code in different versions and emailing with its developers to get something working, which just speaks to the state that framework and documentation happened to be in at the time, but when I did get it working I found the bug in a few minutes. I essentially set up a visual depiction of the search tree where I could click on a branch and have the framework run until that branch came up again to the front of the queue. This meant I could trace execution linearly by giving myself a way to get a handle on the control flow via a visual interface. I have since changed my framework
and broken the debugger code, but I definitely intend to try to get that
rigged up again when the logic system is in a more polished form.
Admittedly, many programs probably do not have the problem that their control flow is so complex that a normal linear debugger is too difficult to understand, but on some level the ability to specify a debugging control flow outside the execution of the program itself seems like a pretty powerful idea, and something Pharo should be very well suited for with its interactivity/reflectivity. Maybe there would be more complex, logic-based programs if they weren't so hard to write!
Evan
-- View this message in context: http://forum.world.st/What-is-the-craziest-bug-you-ever-face-tp4937984p49380... Sent from the Pharo Smalltalk Users mailing list archive at Nabble.com.
-- Using Opera's mail client: http://www.opera.com/mail/
Yeah, that sounds right. The debugger needed to be able to step through lines of code like normal (to debug the logic framework) as well as to step through search steps (to debug programs written in the framework) defined in terms of the system semantics (since bugs could be in either program or framework at this point). It also needed to recognize the semantics not only of the framework, but of the debugging interaction, because I needed it to step through the search space until it arrived at a particular leaf of the search frontier. The framework itself basically does a breadth-first-search, and it doesn't care when a particular frontier node will be visited again, but if I am tracing the search in one particular part of the space for the very specific purposes of debugging, only then do I need the debugger to recognize the semantics of when we are expanding a child of a given frontier node. I also played with the idea of actually changing the search order while debugging, which would change the semantics of the actual running program to make it turn out a certain way so that I could observe rare behavior. The analogy would be manually setting a random number in the debugger, except that it might take more than a single instance variable assignment to change the structure of a search tree. Evan -- View this message in context: http://forum.world.st/What-is-the-craziest-bug-you-ever-face-tp4937984p49380... Sent from the Pharo Smalltalk Users mailing list archive at Nabble.com.
we were talking during the workshop and on the simple things to help. - watch points with history of the value. - stop if the value of an instance variable is getting irregular i.e., = you get integer and suddenly inside you get a float! 1 1 1 1 2 3 4 2 2 1 1 12 2 3 32 1 1 1 1 22 1 1 1 1 1 1 1 2 33 1.2 2 3 3 4 4 - start to monitor (put alarm/breakpoints) newly created instances from a point I hope that soon we will have instance specific features of the Ressia debugger in Pharo debuger (stop the next time this object receive a message, stop the next tie this object changes any of its instance variables).

Hi Stephane, bugs i found difficult to debug are eg (1) red cross of death bugs in morphs, (2) bugs that are not visible any more because they are caught and dealt with in the wrong place and then produce wrong results instead of errors, and (3) bugs in iterative algos that work eg with #while and that pop up eg in the 1000th iteration, where i first have to add a counter to know that it happens in the 1000th iteration and then have to add a #halt if counter=999 to see what happens then in the debugger. werner On 03/09/2017 12:36 PM, Stephane Ducasse wrote:
Hi guys
During the DSU workshop we were brainstorming about what are the most difficult bugs we faced and what are the conceptual tools that would have helped you.
Stef
and occasionally memory leaks werner On 03/10/2017 04:02 PM, werner kassens wrote:
Hi Stephane, bugs i found difficult to debug are eg (1) red cross of death bugs in morphs, (2) bugs that are not visible any more because they are caught and dealt with in the wrong place and then produce wrong results instead of errors, and (3) bugs in iterative algos that work eg with #while and that pop up eg in the 1000th iteration, where i first have to add a counter to know that it happens in the 1000th iteration and then have to add a #halt if counter=999 to see what happens then in the debugger. werner
On 03/09/2017 12:36 PM, Stephane Ducasse wrote:
Hi guys
During the DSU workshop we were brainstorming about what are the most difficult bugs we faced and what are the conceptual tools that would have helped you.
Stef

This is not so much about debugging; it's a much more general issue. Given that Smalltalk is designed to allow one to interact with objects, it always frustrates me when our many browsers hide their implementation. We should be able to open inspectors on the model and the UI instance quickly and easily. These would greatly facilitate learning how the browsers works and to be able to script things that the browser developer did not include. e.g. How many methods am I looking at in this method browser? e.g. I want to open a new method browser on a subset of the methods I am looking at. (The rewrite tool helps when the criteria are syntax-based, but ...) and many more things. _____ From: Pharo-users [mailto:pharo-users-bounces@lists.pharo.org] On Behalf Of Stephane Ducasse Sent: March 9, 2017 03:37 To: Any question about pharo is welcome; Pharo Development List Subject: [Pharo-users] What is the craziest bug you ever face Hi guys During the DSU workshop we were brainstorming about what are the most difficult bugs we faced and what are the conceptual tools that would have helped you. Stef

When I was developing a new Morphic layout policy (in Squeak before there was Pharo, but I imagine it still applies), I found numerous bugs relating to bounds and layout methods and the order they get called in various circumstances; bounds & layout is a poorly documented, fragile part of Morphic. It was a long time ago, so I have forgotten the details, but periodically, something I wrote for my layout would add or trigger one of these bugs, the entire GUI would stop working, and I would be left with the emergency debugger. I didn't & probably don't have enough skill with the emergency debugger to debug order & layout issues in objects I can no longer see, so I would roll back my latest change & keep working blind, trying to guess what went wrong. Of course if you get the emergency debugger, you can't see anything that was in the Transcript either. I vaguely recall making a lot faster progress after finding a way to put a conditional halt in the layout methods, so more of the time, I could have only that object be messed up while I stepped through what was happening. I don't know about concepts, but two actual tools that might have helped (and for all I know, existed but I didn't/don't know about them): - Some kind of sandbox like projects, where changes apply to some subset of objects first, before you roll them out to all objects. But, to help in this case, it would have to allow display of objects from multiple "projects" in the same world, so that the debugger would still work if bounds calculations were messed up for the test objects. - A message passing visualizer that could show an animation of a conversation log among collaborating objects. You could give it a couple of objects and classes to start with, and it could show instance variables that are likely to indicate relationships as well as a sequence of messages that were passed. To see what you wanted, you could hide specific messages, or unhide specific messages, or zoom in on a specific moment. It's changing the topic a little (since dealing with security bugs is part of what I do, they aren't difficult or unusual for me), but from a security perspective, it seems to be difficult for developers to understand and (for Smalltalk developers especially) believe the security bugs they write. These bugs may not result in functionality problems until the code is attacked. It would be good for the community if we had a visual taint tracker. This could help people see injection vulnerabilities, which seem to be the most often disbelieved. When you inspect an object, you could see e.g. which data came directly from the network. To change the data from red to green, you would need to validate it in some way, or (dangerously) mark data sources as trusted. We would need a taint tracking infrastructure to make this possible, so it would be a substantial project, but e.g. perl (of all languages) has had that part for 20 years. Telling a tool where you think your validation perimeter is, or which instance variables you are trusting, would be especially neat, since if you saw tainted data inside that perimeter, you would know you had a problem. Ah, so easy to wave ideas around, so much more work to actually implement them. :/ Brenda
On Mar 9, 2017, at 5:36 AM, Stephane Ducasse <stepharo.self@gmail.com> wrote:
Hi guys
During the DSU workshop we were brainstorming about what are the most difficult bugs we faced and what are the conceptual tools that would have helped you.
Stef
participants (14)
-
 Benoit St-Jean
 -
 Brenda Larcom
 -
 Dale Henrichs
 -
 Dimitris Chloupis
 -
 Evan Donahue
 -
 Holger Freyther
 -
 Igor Stasenko
 -
 Max Leske
 -
 Nicolai Hess
 -
 Offray Vladimir Luna Cárdenas
 -
 Richard Sargent
 -
 Stephane Ducasse
 -
 stepharong
 -
 werner kassens