Roassal HTML exporter

Hi! We have worked very hard on a Roassal exporter for the Web. Milton has produced the class RTHTML5Exporter, which may be simply invoked as: RTHTML5Exporter new export: aRoassalView. Check this out: https://dl.dropboxusercontent.com/u/31543901/RoassalHTML/index.html Try moving the mouse above the circle or dots in the curve. The html file you see from your web browser is the result of do-iting the following expression: -=-=-=-=-=-=-=-=-=-=-=-=-=-=-=-=-=-=-=-=-=-=-=-=-=-=-=-=-=-=-=-= -=-=-=-=-=-=-=-=-=-=-=-=-=-=-=-=-=-=-=-=-=-=-=-=-=-=-=-=-=-=-=-= | c b c2 | c := RTComposer new. "======" b := RTGraphBuilder new. b view: c view. b edges connectFrom: #superclass; useInLayout. b edges if: [ :fromClass :toClass | toClass name beginsWith: 'TR' ]; connectTo: #dependentClasses; color: (Color blue alpha: 0.3). b nodes if: [ :cls | cls name beginsWith: 'RT' ]; color: Color blue. b nodes color: Color red. b layout cluster. b global normalizeSize: #numberOfMethods min: 5 max: 40 using: #sqrt; alphaColor: 0.4. b addAll: TRShape withAllSubclasses, RTShape withAllSubclasses. b build. c group. "======" c2 := RTCharterBuilder new. c2 view: c view. c2 interaction popup. c2 extent: 300 @ 200. c2 points: (RTShape withAllSubclasses sortedAs: #numberOfMethods). c2 connectDotColor: Color blue. c2 points: (TRShape withAllSubclasses sortedAs: #numberOfMethods). c2 stackX. c2 allY: #numberOfMethods. c2 connectDotColor: Color red. c2 axisX. c2 axisY. c2 build. c group. "======" c layout: RTVerticalLineLayout new. c propagateHighlightToAll. "======" legend := RTLegendBuilder new. legend view: c view. legend addText: 'This is a demonsration of a combination of builders'. legend addText: 'The above visualization shows the dependencies between Roassal and Trachel shapes.'. legend addText: 'Curves indicate the distribution of the number of methods'. legend build. "======" RTHTML5Exporter new export: c view. c view -=-=-=-=-=-=-=-=-=-=-=-=-=-=-=-=-=-=-=-=-=-=-=-=-=-=-=-=-=-=-=-= -=-=-=-=-=-=-=-=-=-=-=-=-=-=-=-=-=-=-=-=-=-=-=-=-=-=-=-=-=-=-=-= -- _,.;:~^~:;._,.;:~^~:;._,.;:~^~:;._,.;:~^~:;._,.;: Alexandre Bergel http://www.bergel.eu ^~:;._,.;:~^~:;._,.;:~^~:;._,.;:~^~:;._,.;:~^~:;.

Oooh! Very nice. I will try to integrate that into my software. A question: the color palettes are quite faded in Roassal examples (e.g. when I use the UML builder, some are light on light and hard to read). How hard is it to have a palette like this one for example: http://patterntap.com/pattern/color-palette-flat-ui-colors Congrats for the great job! Phil On Fri, Dec 12, 2014 at 12:20 AM, Alexandre Bergel <alexandre.bergel@me.com> wrote:
Hi!
We have worked very hard on a Roassal exporter for the Web.
Milton has produced the class RTHTML5Exporter, which may be simply invoked as: RTHTML5Exporter new export: aRoassalView.
Check this out: https://dl.dropboxusercontent.com/u/31543901/RoassalHTML/index.html
Try moving the mouse above the circle or dots in the curve.
The html file you see from your web browser is the result of do-iting the following expression: -=-=-=-=-=-=-=-=-=-=-=-=-=-=-=-=-=-=-=-=-=-=-=-=-=-=-=-=-=-=-=-= -=-=-=-=-=-=-=-=-=-=-=-=-=-=-=-=-=-=-=-=-=-=-=-=-=-=-=-=-=-=-=-= | c b c2 | c := RTComposer new.
"======" b := RTGraphBuilder new. b view: c view. b edges connectFrom: #superclass; useInLayout.
b edges if: [ :fromClass :toClass | toClass name beginsWith: 'TR' ]; connectTo: #dependentClasses; color: (Color blue alpha: 0.3).
b nodes if: [ :cls | cls name beginsWith: 'RT' ]; color: Color blue. b nodes color: Color red. b layout cluster.
b global normalizeSize: #numberOfMethods min: 5 max: 40 using: #sqrt; alphaColor: 0.4.
b addAll: TRShape withAllSubclasses, RTShape withAllSubclasses.
b build. c group.
"======" c2 := RTCharterBuilder new. c2 view: c view.
c2 interaction popup. c2 extent: 300 @ 200. c2 points: (RTShape withAllSubclasses sortedAs: #numberOfMethods). c2 connectDotColor: Color blue.
c2 points: (TRShape withAllSubclasses sortedAs: #numberOfMethods). c2 stackX. c2 allY: #numberOfMethods. c2 connectDotColor: Color red.
c2 axisX. c2 axisY. c2 build. c group. "======"
c layout: RTVerticalLineLayout new. c propagateHighlightToAll. "======"
legend := RTLegendBuilder new. legend view: c view. legend addText: 'This is a demonsration of a combination of builders'. legend addText: 'The above visualization shows the dependencies between Roassal and Trachel shapes.'. legend addText: 'Curves indicate the distribution of the number of methods'. legend build. "======"
RTHTML5Exporter new export: c view. c view -=-=-=-=-=-=-=-=-=-=-=-=-=-=-=-=-=-=-=-=-=-=-=-=-=-=-=-=-=-=-=-= -=-=-=-=-=-=-=-=-=-=-=-=-=-=-=-=-=-=-=-=-=-=-=-=-=-=-=-=-=-=-=-=
-- _,.;:~^~:;._,.;:~^~:;._,.;:~^~:;._,.;:~^~:;._,.;: Alexandre Bergel http://www.bergel.eu ^~:;._,.;:~^~:;._,.;:~^~:;._,.;:~^~:;._,.;:~^~:;.

super How does it work? Visitor? Stef Le 12/12/14 09:45, phil@highoctane.be a écrit :
Hi!
We have worked very hard on a Roassal exporter for the Web.
Milton has produced the class RTHTML5Exporter, which may be simply invoked as: RTHTML5Exporter new export: aRoassalView.
Check this out: https://dl.dropboxusercontent.com/u/31543901/RoassalHTML/index.html
Try moving the mouse above the circle or dots in the curve.
The html file you see from your web browser is the result of do-iting the following expression: -=-=-=-=-=-=-=-=-=-=-=-=-=-=-=-=-=-=-=-=-=-=-=-=-=-=-=-=-=-=-=-= -=-=-=-=-=-=-=-=-=-=-=-=-=-=-=-=-=-=-=-=-=-=-=-=-=-=-=-=-=-=-=-= | c b c2 | c := RTComposer new.
"======" b := RTGraphBuilder new. b view: c view. b edges connectFrom: #superclass; useInLayout.
b edges if: [ :fromClass :toClass | toClass name beginsWith: 'TR' ]; connectTo: #dependentClasses; color: (Color blue alpha: 0.3).
b nodes if: [ :cls | cls name beginsWith: 'RT' ]; color: Color blue. b nodes color: Color red. b layout cluster.
b global normalizeSize: #numberOfMethods min: 5 max: 40 using: #sqrt; alphaColor: 0.4.
b addAll: TRShape withAllSubclasses, RTShape withAllSubclasses.
b build. c group.
"======" c2 := RTCharterBuilder new. c2 view: c view.
c2 interaction popup. c2 extent: 300 @ 200. c2 points: (RTShape withAllSubclasses sortedAs: #numberOfMethods). c2 connectDotColor: Color blue.
c2 points: (TRShape withAllSubclasses sortedAs: #numberOfMethods). c2 stackX. c2 allY: #numberOfMethods. c2 connectDotColor: Color red.
c2 axisX. c2 axisY. c2 build. c group. "======"
c layout: RTVerticalLineLayout new. c propagateHighlightToAll. "======"
legend := RTLegendBuilder new. legend view: c view. legend addText: 'This is a demonsration of a combination of builders'. legend addText: 'The above visualization shows the dependencies between Roassal and Trachel shapes.'. legend addText: 'Curves indicate the distribution of the number of methods'. legend build. "======"
RTHTML5Exporter new export: c view. c view -=-=-=-=-=-=-=-=-=-=-=-=-=-=-=-=-=-=-=-=-=-=-=-=-=-=-=-=-=-=-=-= -=-=-=-=-=-=-=-=-=-=-=-=-=-=-=-=-=-=-=-=-=-=-=-=-=-=-=-=-=-=-=-=
I will try to integrate that into my software.
Let us know how it goes!
A question: the color palettes are quite faded in Roassal examples (e.g. when I use the UML builder, some are light on light and hard to read).
How hard is it to have a palette like this one for example: http://patterntap.com/pattern/color-palette-flat-ui-colors <http://patterntap.com/pattern/color-palette-flat-ui-colors> It should be difficult at all. We will work on this.
Congrats for the great job!
Thanks :-) Being able to comfortably export to HTML is probably the greatest challenge Roassal will have to face. Your feedback is highly important for us. Cheers, Alexandre
On Fri, Dec 12, 2014 at 12:20 AM, Alexandre Bergel <alexandre.bergel@me.com <mailto:alexandre.bergel@me.com>> wrote: Hi!
We have worked very hard on a Roassal exporter for the Web.
Milton has produced the class RTHTML5Exporter, which may be simply invoked as: RTHTML5Exporter new export: aRoassalView.
Check this out: https://dl.dropboxusercontent.com/u/31543901/RoassalHTML/index.html <https://dl.dropboxusercontent.com/u/31543901/RoassalHTML/index.html>
Try moving the mouse above the circle or dots in the curve.
The html file you see from your web browser is the result of do-iting the following expression: -=-=-=-=-=-=-=-=-=-=-=-=-=-=-=-=-=-=-=-=-=-=-=-=-=-=-=-=-=-=-=-= -=-=-=-=-=-=-=-=-=-=-=-=-=-=-=-=-=-=-=-=-=-=-=-=-=-=-=-=-=-=-=-= | c b c2 | c := RTComposer new.
"======" b := RTGraphBuilder new. b view: c view. b edges connectFrom: #superclass; useInLayout.
b edges if: [ :fromClass :toClass | toClass name beginsWith: 'TR' ]; connectTo: #dependentClasses; color: (Color blue alpha: 0.3).
b nodes if: [ :cls | cls name beginsWith: 'RT' ]; color: Color blue. b nodes color: Color red. b layout cluster.
b global normalizeSize: #numberOfMethods min: 5 max: 40 using: #sqrt; alphaColor: 0.4.
b addAll: TRShape withAllSubclasses, RTShape withAllSubclasses.
b build. c group.
"======" c2 := RTCharterBuilder new. c2 view: c view.
c2 interaction popup. c2 extent: 300 @ 200. c2 points: (RTShape withAllSubclasses sortedAs: #numberOfMethods). c2 connectDotColor: Color blue.
c2 points: (TRShape withAllSubclasses sortedAs: #numberOfMethods). c2 stackX. c2 allY: #numberOfMethods. c2 connectDotColor: Color red.
c2 axisX. c2 axisY. c2 build. c group. "======"
c layout: RTVerticalLineLayout new. c propagateHighlightToAll. "======"
legend := RTLegendBuilder new. legend view: c view. legend addText: 'This is a demonsration of a combination of builders'. legend addText: 'The above visualization shows the dependencies between Roassal and Trachel shapes.'. legend addText: 'Curves indicate the distribution of the number of methods'. legend build. "======"
RTHTML5Exporter new export: c view. c view -=-=-=-=-=-=-=-=-=-=-=-=-=-=-=-=-=-=-=-=-=-=-=-=-=-=-=-=-=-=-=-= -=-=-=-=-=-=-=-=-=-=-=-=-=-=-=-=-=-=-=-=-=-=-=-=-=-=-=-=-=-=-=-=
-- _,.;:~^~:;._,.;:~^~:;._,.;:~^~:;._,.;:~^~:;._,.;: Alexandre Bergel http://www.bergel.eu <http://www.bergel.eu/> ^~:;._,.;:~^~:;._,.;:~^~:;._,.;:~^~:;._,.;:~^~:;.

After some explanations and examples with Hamilton, I can certify this exporter is awesome ! Yes we'll take a look at the palette today Pierre 2014-12-12 9:58 GMT-03:00 Alexandre Bergel <alexandre.bergel@me.com>:
I will try to integrate that into my software.
Let us know how it goes!
A question: the color palettes are quite faded in Roassal examples (e.g. when I use the UML builder, some are light on light and hard to read).
How hard is it to have a palette like this one for example: http://patterntap.com/pattern/color-palette-flat-ui-colors
It should be difficult at all. We will work on this.
Congrats for the great job!
Thanks :-) Being able to comfortably export to HTML is probably the greatest challenge Roassal will have to face. Your feedback is highly important for us.
Cheers, Alexandre
On Fri, Dec 12, 2014 at 12:20 AM, Alexandre Bergel < alexandre.bergel@me.com> wrote:
Hi!
We have worked very hard on a Roassal exporter for the Web.
Milton has produced the class RTHTML5Exporter, which may be simply invoked as: RTHTML5Exporter new export: aRoassalView.
Check this out: https://dl.dropboxusercontent.com/u/31543901/RoassalHTML/index.html
Try moving the mouse above the circle or dots in the curve.
The html file you see from your web browser is the result of do-iting the following expression: -=-=-=-=-=-=-=-=-=-=-=-=-=-=-=-=-=-=-=-=-=-=-=-=-=-=-=-=-=-=-=-= -=-=-=-=-=-=-=-=-=-=-=-=-=-=-=-=-=-=-=-=-=-=-=-=-=-=-=-=-=-=-=-= | c b c2 | c := RTComposer new.
"======" b := RTGraphBuilder new. b view: c view. b edges connectFrom: #superclass; useInLayout.
b edges if: [ :fromClass :toClass | toClass name beginsWith: 'TR' ]; connectTo: #dependentClasses; color: (Color blue alpha: 0.3).
b nodes if: [ :cls | cls name beginsWith: 'RT' ]; color: Color blue. b nodes color: Color red. b layout cluster.
b global normalizeSize: #numberOfMethods min: 5 max: 40 using: #sqrt; alphaColor: 0.4.
b addAll: TRShape withAllSubclasses, RTShape withAllSubclasses.
b build. c group.
"======" c2 := RTCharterBuilder new. c2 view: c view.
c2 interaction popup. c2 extent: 300 @ 200. c2 points: (RTShape withAllSubclasses sortedAs: #numberOfMethods). c2 connectDotColor: Color blue.
c2 points: (TRShape withAllSubclasses sortedAs: #numberOfMethods). c2 stackX. c2 allY: #numberOfMethods. c2 connectDotColor: Color red.
c2 axisX. c2 axisY. c2 build. c group. "======"
c layout: RTVerticalLineLayout new. c propagateHighlightToAll. "======"
legend := RTLegendBuilder new. legend view: c view. legend addText: 'This is a demonsration of a combination of builders'. legend addText: 'The above visualization shows the dependencies between Roassal and Trachel shapes.'. legend addText: 'Curves indicate the distribution of the number of methods'. legend build. "======"
RTHTML5Exporter new export: c view. c view -=-=-=-=-=-=-=-=-=-=-=-=-=-=-=-=-=-=-=-=-=-=-=-=-=-=-=-=-=-=-=-= -=-=-=-=-=-=-=-=-=-=-=-=-=-=-=-=-=-=-=-=-=-=-=-=-=-=-=-=-=-=-=-=
-- _,.;:~^~:;._,.;:~^~:;._,.;:~^~:;._,.;:~^~:;._,.;: Alexandre Bergel http://www.bergel.eu ^~:;._,.;:~^~:;._,.;:~^~:;._,.;:~^~:;._,.;:~^~:;.
2014-12-12 5:45 GMT-03:00 phil@highoctane.be <phil@highoctane.be>:
How hard is it to have a palette like this one for example: http://patterntap.com/pattern/color-palette-flat-ui-colors
Hi, these palette is now available on Roassal2 -=--=-=-=-=--=-=-=-=-=-=-=-=-=-=-=-=-=-=--= v := RTView new. pal := ColorPalette qualitative colors: 20 scheme:'FlatUI1'. elems := (RTBox new size: 60) elementsOn: pal. elems do: [ :e | e color: e model. ]. v addAll: elems. RTFlowLayout new on: elems. v -=-=-=-=-=-=-=-=-=-=-=-=-=-=-=-=-=-=-=-=-= âSincerely yours, Pierre
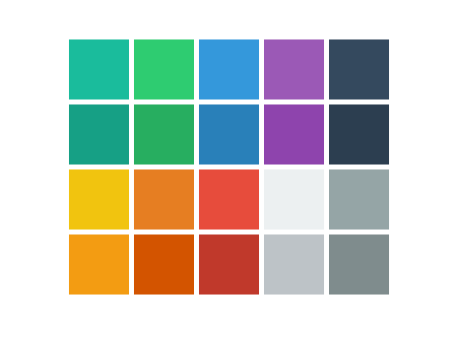

Nice result! Doru On Fri, Dec 12, 2014 at 1:20 AM, Alexandre Bergel <alexandre.bergel@me.com> wrote:
Hi!
We have worked very hard on a Roassal exporter for the Web.
Milton has produced the class RTHTML5Exporter, which may be simply invoked as: RTHTML5Exporter new export: aRoassalView.
Check this out: https://dl.dropboxusercontent.com/u/31543901/RoassalHTML/index.html
Try moving the mouse above the circle or dots in the curve.
The html file you see from your web browser is the result of do-iting the following expression: -=-=-=-=-=-=-=-=-=-=-=-=-=-=-=-=-=-=-=-=-=-=-=-=-=-=-=-=-=-=-=-= -=-=-=-=-=-=-=-=-=-=-=-=-=-=-=-=-=-=-=-=-=-=-=-=-=-=-=-=-=-=-=-= | c b c2 | c := RTComposer new.
"======" b := RTGraphBuilder new. b view: c view. b edges connectFrom: #superclass; useInLayout.
b edges if: [ :fromClass :toClass | toClass name beginsWith: 'TR' ]; connectTo: #dependentClasses; color: (Color blue alpha: 0.3).
b nodes if: [ :cls | cls name beginsWith: 'RT' ]; color: Color blue. b nodes color: Color red. b layout cluster.
b global normalizeSize: #numberOfMethods min: 5 max: 40 using: #sqrt; alphaColor: 0.4.
b addAll: TRShape withAllSubclasses, RTShape withAllSubclasses.
b build. c group.
"======" c2 := RTCharterBuilder new. c2 view: c view.
c2 interaction popup. c2 extent: 300 @ 200. c2 points: (RTShape withAllSubclasses sortedAs: #numberOfMethods). c2 connectDotColor: Color blue.
c2 points: (TRShape withAllSubclasses sortedAs: #numberOfMethods). c2 stackX. c2 allY: #numberOfMethods. c2 connectDotColor: Color red.
c2 axisX. c2 axisY. c2 build. c group. "======"
c layout: RTVerticalLineLayout new. c propagateHighlightToAll. "======"
legend := RTLegendBuilder new. legend view: c view. legend addText: 'This is a demonsration of a combination of builders'. legend addText: 'The above visualization shows the dependencies between Roassal and Trachel shapes.'. legend addText: 'Curves indicate the distribution of the number of methods'. legend build. "======"
RTHTML5Exporter new export: c view. c view -=-=-=-=-=-=-=-=-=-=-=-=-=-=-=-=-=-=-=-=-=-=-=-=-=-=-=-=-=-=-=-= -=-=-=-=-=-=-=-=-=-=-=-=-=-=-=-=-=-=-=-=-=-=-=-=-=-=-=-=-=-=-=-=
-- _,.;:~^~:;._,.;:~^~:;._,.;:~^~:;._,.;:~^~:;._,.;: Alexandre Bergel http://www.bergel.eu ^~:;._,.;:~^~:;._,.;:~^~:;._,.;:~^~:;._,.;:~^~:;.
-- www.tudorgirba.com "Every thing has its own flow"

Hi Alexandre, this is great. There is a bit of javascript magic going in there, isn't it? (<script type="text/javascript" src="RODraggingAndUtil.js"></script>) When adding some specific support such as the OpenStreetMap data, there is a bit of work to do to extend it? Or would it consider it as a bitmap? Thanks, Thierry 2014-12-12 0:20 GMT+01:00 Alexandre Bergel <alexandre.bergel@me.com>:
Hi!
We have worked very hard on a Roassal exporter for the Web.
Milton has produced the class RTHTML5Exporter, which may be simply invoked as: RTHTML5Exporter new export: aRoassalView.
Check this out: https://dl.dropboxusercontent.com/u/31543901/RoassalHTML/index.html
Try moving the mouse above the circle or dots in the curve.
The html file you see from your web browser is the result of do-iting the following expression: -=-=-=-=-=-=-=-=-=-=-=-=-=-=-=-=-=-=-=-=-=-=-=-=-=-=-=-=-=-=-=-= -=-=-=-=-=-=-=-=-=-=-=-=-=-=-=-=-=-=-=-=-=-=-=-=-=-=-=-=-=-=-=-= | c b c2 | c := RTComposer new.
"======" b := RTGraphBuilder new. b view: c view. b edges connectFrom: #superclass; useInLayout.
b edges if: [ :fromClass :toClass | toClass name beginsWith: 'TR' ]; connectTo: #dependentClasses; color: (Color blue alpha: 0.3).
b nodes if: [ :cls | cls name beginsWith: 'RT' ]; color: Color blue. b nodes color: Color red. b layout cluster.
b global normalizeSize: #numberOfMethods min: 5 max: 40 using: #sqrt; alphaColor: 0.4.
b addAll: TRShape withAllSubclasses, RTShape withAllSubclasses.
b build. c group.
"======" c2 := RTCharterBuilder new. c2 view: c view.
c2 interaction popup. c2 extent: 300 @ 200. c2 points: (RTShape withAllSubclasses sortedAs: #numberOfMethods). c2 connectDotColor: Color blue.
c2 points: (TRShape withAllSubclasses sortedAs: #numberOfMethods). c2 stackX. c2 allY: #numberOfMethods. c2 connectDotColor: Color red.
c2 axisX. c2 axisY. c2 build. c group. "======"
c layout: RTVerticalLineLayout new. c propagateHighlightToAll. "======"
legend := RTLegendBuilder new. legend view: c view. legend addText: 'This is a demonsration of a combination of builders'. legend addText: 'The above visualization shows the dependencies between Roassal and Trachel shapes.'. legend addText: 'Curves indicate the distribution of the number of methods'. legend build. "======"
RTHTML5Exporter new export: c view. c view -=-=-=-=-=-=-=-=-=-=-=-=-=-=-=-=-=-=-=-=-=-=-=-=-=-=-=-=-=-=-=-= -=-=-=-=-=-=-=-=-=-=-=-=-=-=-=-=-=-=-=-=-=-=-=-=-=-=-=-=-=-=-=-=
-- _,.;:~^~:;._,.;:~^~:;._,.;:~^~:;._,.;:~^~:;._,.;: Alexandre Bergel http://www.bergel.eu ^~:;._,.;:~^~:;._,.;:~^~:;._,.;:~^~:;._,.;:~^~:;.
First, I need to incorporate your OpenStreetMap bidding into Roassal. This is on my todo list and I will work on this. This is highly important for Roassal. Second, I have the impression that we will need a kind of JavaScript template for this OSM integration. We will have a look at this. Cheers, Alexandre -- _,.;:~^~:;._,.;:~^~:;._,.;:~^~:;._,.;:~^~:;._,.;: Alexandre Bergel http://www.bergel.eu ^~:;._,.;:~^~:;._,.;:~^~:;._,.;:~^~:;._,.;:~^~:;.
On Dec 12, 2014, at 12:38 PM, Thierry Goubier <thierry.goubier@gmail.com> wrote:
Hi Alexandre,
this is great. There is a bit of javascript magic going in there, isn't it?
(<script type="text/javascript" src="RODraggingAndUtil.js"></script>)
When adding some specific support such as the OpenStreetMap data, there is a bit of work to do to extend it? Or would it consider it as a bitmap?
Thanks,
Thierry
2014-12-12 0:20 GMT+01:00 Alexandre Bergel <alexandre.bergel@me.com <mailto:alexandre.bergel@me.com>>: Hi!
We have worked very hard on a Roassal exporter for the Web.
Milton has produced the class RTHTML5Exporter, which may be simply invoked as: RTHTML5Exporter new export: aRoassalView.
Check this out: https://dl.dropboxusercontent.com/u/31543901/RoassalHTML/index.html <https://dl.dropboxusercontent.com/u/31543901/RoassalHTML/index.html>
Try moving the mouse above the circle or dots in the curve.
The html file you see from your web browser is the result of do-iting the following expression: -=-=-=-=-=-=-=-=-=-=-=-=-=-=-=-=-=-=-=-=-=-=-=-=-=-=-=-=-=-=-=-= -=-=-=-=-=-=-=-=-=-=-=-=-=-=-=-=-=-=-=-=-=-=-=-=-=-=-=-=-=-=-=-= | c b c2 | c := RTComposer new.
"======" b := RTGraphBuilder new. b view: c view. b edges connectFrom: #superclass; useInLayout.
b edges if: [ :fromClass :toClass | toClass name beginsWith: 'TR' ]; connectTo: #dependentClasses; color: (Color blue alpha: 0.3).
b nodes if: [ :cls | cls name beginsWith: 'RT' ]; color: Color blue. b nodes color: Color red. b layout cluster.
b global normalizeSize: #numberOfMethods min: 5 max: 40 using: #sqrt; alphaColor: 0.4.
b addAll: TRShape withAllSubclasses, RTShape withAllSubclasses.
b build. c group.
"======" c2 := RTCharterBuilder new. c2 view: c view.
c2 interaction popup. c2 extent: 300 @ 200. c2 points: (RTShape withAllSubclasses sortedAs: #numberOfMethods). c2 connectDotColor: Color blue.
c2 points: (TRShape withAllSubclasses sortedAs: #numberOfMethods). c2 stackX. c2 allY: #numberOfMethods. c2 connectDotColor: Color red.
c2 axisX. c2 axisY. c2 build. c group. "======"
c layout: RTVerticalLineLayout new. c propagateHighlightToAll. "======"
legend := RTLegendBuilder new. legend view: c view. legend addText: 'This is a demonsration of a combination of builders'. legend addText: 'The above visualization shows the dependencies between Roassal and Trachel shapes.'. legend addText: 'Curves indicate the distribution of the number of methods'. legend build. "======"
RTHTML5Exporter new export: c view. c view -=-=-=-=-=-=-=-=-=-=-=-=-=-=-=-=-=-=-=-=-=-=-=-=-=-=-=-=-=-=-=-= -=-=-=-=-=-=-=-=-=-=-=-=-=-=-=-=-=-=-=-=-=-=-=-=-=-=-=-=-=-=-=-=
-- _,.;:~^~:;._,.;:~^~:;._,.;:~^~:;._,.;:~^~:;._,.;: Alexandre Bergel http://www.bergel.eu <http://www.bergel.eu/> ^~:;._,.;:~^~:;._,.;:~^~:;._,.;:~^~:;._,.;:~^~:;.

Excellent! El Fri Dec 12 2014 at 2:45:03 PM, Alexandre Bergel <alexandre.bergel@me.com> escribió:
First, I need to incorporate your OpenStreetMap bidding into Roassal. This is on my todo list and I will work on this. This is highly important for Roassal.
Second, I have the impression that we will need a kind of JavaScript template for this OSM integration. We will have a look at this.
Cheers, Alexandre
-- _,.;:~^~:;._,.;:~^~:;._,.;:~^~:;._,.;:~^~:;._,.;: Alexandre Bergel http://www.bergel.eu ^~:;._,.;:~^~:;._,.;:~^~:;._,.;:~^~:;._,.;:~^~:;.
On Dec 12, 2014, at 12:38 PM, Thierry Goubier <thierry.goubier@gmail.com> wrote:
Hi Alexandre,
this is great. There is a bit of javascript magic going in there, isn't it?
(<script type="text/javascript" src="RODraggingAndUtil.js"></script>)
When adding some specific support such as the OpenStreetMap data, there is a bit of work to do to extend it? Or would it consider it as a bitmap?
Thanks,
Thierry
2014-12-12 0:20 GMT+01:00 Alexandre Bergel <alexandre.bergel@me.com>:
Hi!
We have worked very hard on a Roassal exporter for the Web.
Milton has produced the class RTHTML5Exporter, which may be simply invoked as: RTHTML5Exporter new export: aRoassalView.
Check this out: https://dl.dropboxusercontent.com/u/31543901/RoassalHTML/index.html
Try moving the mouse above the circle or dots in the curve.
The html file you see from your web browser is the result of do-iting the following expression: -=-=-=-=-=-=-=-=-=-=-=-=-=-=-=-=-=-=-=-=-=-=-=-=-=-=-=-=-=-=-=-= -=-=-=-=-=-=-=-=-=-=-=-=-=-=-=-=-=-=-=-=-=-=-=-=-=-=-=-=-=-=-=-= | c b c2 | c := RTComposer new.
"======" b := RTGraphBuilder new. b view: c view. b edges connectFrom: #superclass; useInLayout.
b edges if: [ :fromClass :toClass | toClass name beginsWith: 'TR' ]; connectTo: #dependentClasses; color: (Color blue alpha: 0.3).
b nodes if: [ :cls | cls name beginsWith: 'RT' ]; color: Color blue. b nodes color: Color red. b layout cluster.
b global normalizeSize: #numberOfMethods min: 5 max: 40 using: #sqrt; alphaColor: 0.4.
b addAll: TRShape withAllSubclasses, RTShape withAllSubclasses.
b build. c group.
"======" c2 := RTCharterBuilder new. c2 view: c view.
c2 interaction popup. c2 extent: 300 @ 200. c2 points: (RTShape withAllSubclasses sortedAs: #numberOfMethods). c2 connectDotColor: Color blue.
c2 points: (TRShape withAllSubclasses sortedAs: #numberOfMethods). c2 stackX. c2 allY: #numberOfMethods. c2 connectDotColor: Color red.
c2 axisX. c2 axisY. c2 build. c group. "======"
c layout: RTVerticalLineLayout new. c propagateHighlightToAll. "======"
legend := RTLegendBuilder new. legend view: c view. legend addText: 'This is a demonsration of a combination of builders'. legend addText: 'The above visualization shows the dependencies between Roassal and Trachel shapes.'. legend addText: 'Curves indicate the distribution of the number of methods'. legend build. "======"
RTHTML5Exporter new export: c view. c view -=-=-=-=-=-=-=-=-=-=-=-=-=-=-=-=-=-=-=-=-=-=-=-=-=-=-=-=-=-=-=-= -=-=-=-=-=-=-=-=-=-=-=-=-=-=-=-=-=-=-=-=-=-=-=-=-=-=-=-=-=-=-=-=
-- _,.;:~^~:;._,.;:~^~:;._,.;:~^~:;._,.;:~^~:;._,.;: Alexandre Bergel http://www.bergel.eu ^~:;._,.;:~^~:;._,.;:~^~:;._,.;:~^~:;._,.;:~^~:;.
Le 12/12/2014 18:44, Alexandre Bergel a écrit :
First, I need to incorporate your OpenStreetMap bidding into Roassal. This is on my todo list and I will work on this. This is highly important for Roassal.
Regarding this integration, I have no idea about how RTOSM would work with layouts... But I'd really like it to. Maybe we can talk a bit about it. I'm not very good with the layout engine in Roassal (otherwise I'll have fixed a few things with the sugiyama layout ;))
Second, I have the impression that we will need a kind of JavaScript template for this OSM integration. We will have a look at this.
If we keep the ability to zoom in and out, I'd say yes. Thierry
Cheers, Alexandre -- _,.;:~^~:;._,.;:~^~:;._,.;:~^~:;._,.;:~^~:;._,.;: Alexandre Bergel http://www.bergel.eu ^~:;._,.;:~^~:;._,.;:~^~:;._,.;:~^~:;._,.;:~^~:;.
On Dec 12, 2014, at 12:38 PM, Thierry Goubier <thierry.goubier@gmail.com <mailto:thierry.goubier@gmail.com>> wrote:
Hi Alexandre,
this is great. There is a bit of javascript magic going in there, isn't it?
(<script type="text/javascript" src="RODraggingAndUtil.js"></script>)
When adding some specific support such as the OpenStreetMap data, there is a bit of work to do to extend it? Or would it consider it as a bitmap?
Thanks,
Thierry
2014-12-12 0:20 GMT+01:00 Alexandre Bergel <alexandre.bergel@me.com <mailto:alexandre.bergel@me.com>>:
Hi!
We have worked very hard on a Roassal exporter for the Web.
Milton has produced the class RTHTML5Exporter, which may be simply invoked as: RTHTML5Exporter new export: aRoassalView.
Check this out: https://dl.dropboxusercontent.com/u/31543901/RoassalHTML/index.html
Try moving the mouse above the circle or dots in the curve.
The html file you see from your web browser is the result of do-iting the following expression: -=-=-=-=-=-=-=-=-=-=-=-=-=-=-=-=-=-=-=-=-=-=-=-=-=-=-=-=-=-=-=-= -=-=-=-=-=-=-=-=-=-=-=-=-=-=-=-=-=-=-=-=-=-=-=-=-=-=-=-=-=-=-=-= | c b c2 | c := RTComposer new.
"======" b := RTGraphBuilder new. b view: c view. b edges connectFrom: #superclass; useInLayout.
b edges if: [ :fromClass :toClass | toClass name beginsWith: 'TR' ]; connectTo: #dependentClasses; color: (Color blue alpha: 0.3).
b nodes if: [ :cls | cls name beginsWith: 'RT' ]; color: Color blue. b nodes color: Color red. b layout cluster.
b global normalizeSize: #numberOfMethods min: 5 max: 40 using: #sqrt; alphaColor: 0.4.
b addAll: TRShape withAllSubclasses, RTShape withAllSubclasses.
b build. c group.
"======" c2 := RTCharterBuilder new. c2 view: c view.
c2 interaction popup. c2 extent: 300 @ 200. c2 points: (RTShape withAllSubclasses sortedAs: #numberOfMethods). c2 connectDotColor: Color blue.
c2 points: (TRShape withAllSubclasses sortedAs: #numberOfMethods). c2 stackX. c2 allY: #numberOfMethods. c2 connectDotColor: Color red.
c2 axisX. c2 axisY. c2 build. c group. "======"
c layout: RTVerticalLineLayout new. c propagateHighlightToAll. "======"
legend := RTLegendBuilder new. legend view: c view. legend addText: 'This is a demonsration of a combination of builders'. legend addText: 'The above visualization shows the dependencies between Roassal and Trachel shapes.'. legend addText: 'Curves indicate the distribution of the number of methods'. legend build. "======"
RTHTML5Exporter new export: c view. c view -=-=-=-=-=-=-=-=-=-=-=-=-=-=-=-=-=-=-=-=-=-=-=-=-=-=-=-=-=-=-=-= -=-=-=-=-=-=-=-=-=-=-=-=-=-=-=-=-=-=-=-=-=-=-=-=-=-=-=-=-=-=-=-=
-- _,.;:~^~:;._,.;:~^~:;._,.;:~^~:;._,.;:~^~:;._,.;: Alexandre Bergel http://www.bergel.eu <http://www.bergel.eu/> ^~:;._,.;:~^~:;._,.;:~^~:;._,.;:~^~:;._,.;:~^~:;.
participants (7)
-
 Alexandre Bergel
 -
 Esteban A. Maringolo
 -
 phil@highoctane.be
 -
 Pierre CHANSON
 -
 stepharo
 -
 Thierry Goubier
 -
 Tudor Girba