
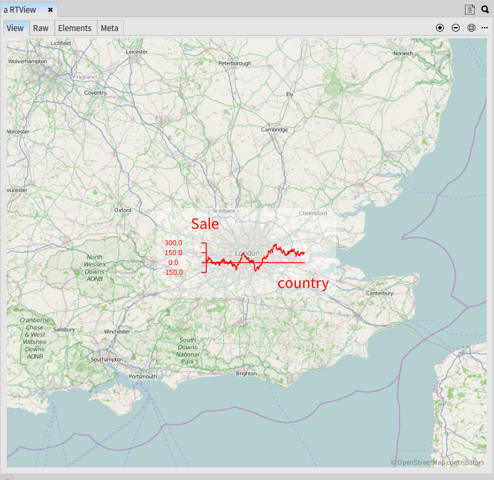
Hi! Some of you have an interest in visualizing graphs on top of open street maps. Together with Hilaire we made a small example: -=-=-=-=-=-=-=-=-=-=-=-= | v map data b d whiteBackground london elementsAndEdges | v := RTView new. v @ RTDraggableView. map := RTOSM new. v add: map element. "Place to set the data and center the camera" london := 51.507222@ -0.1275. "Some arbitrary data" data := ((1 to: 500) collect: [ :i | 50 atRandom - 25 ]) cumsum. "We build the graph" b := RTGrapher new. b extent: 100@30. d := RTData new. d noDot. d connectColor: Color red. d points: data. b add: d. b axisY labelFontHeight: 6; color: Color red; title: 'Sale'. b axisX color: Color red; noTick; title: 'country'. b build. elementsAndEdges := b view elements, b view edges. "We create a white background" whiteBackground := (RTRoundedBox new color: Color white trans; borderRadius: 10) element. v add: whiteBackground. v addAll: elementsAndEdges. RTNest new on: whiteBackground nest: elementsAndEdges. whiteBackground translateTo: (map latLonToRoassal: london). v canvas camera translateTo: (map latLonToRoassal: london). v canvas camera noInitializationWhenOpen. v canvas camera scale: 1.5. v -=-=-=-=-=-=-=-=-=-=-=-= Cheers, Alexandre -- _,.;:~^~:;._,.;:~^~:;._,.;:~^~:;._,.;:~^~:;._,.;: Alexandre Bergel http://www.bergel.eu ^~:;._,.;:~^~:;._,.;:~^~:;._,.;:~^~:;._,.;:~^~:;.
participants (1)
-
 Alexandre Bergel