
Hi all, I had asked a similar question before with no much advances, but today I made a discovery that can improve the things a lot: how to export timeline data as structured JSON [1] (and of course this open the possibility to work with it on Pharo). Now I would like to graph the data as a tree with forks, merges and dates and authors of commits. I have seen chronia, but seems overkill for this feature (and is integrated with CVS only). [1] http://stackoverflow.com/questions/30577090/how-to-export-fossil-scm-timelin... As usual, any pointer on how to get this going will be greatly appreciated and I will give feedback to the community on how to do it. Cheers, Offray
Hi, On a closer detail, seems that [1] contains the starting point I'm looking for. I'll keep you posted and of course any other approach will be listened. [1] https://dl.dropboxusercontent.com/u/31543901/AgileVisualization/Roassal/0104... Cheers, Offray On 01/06/15 22:04, Offray Vladimir Luna Cárdenas wrote:
Hi all,
I had asked a similar question before with no much advances, but today I made a discovery that can improve the things a lot: how to export timeline data as structured JSON [1] (and of course this open the possibility to work with it on Pharo). Now I would like to graph the data as a tree with forks, merges and dates and authors of commits. I have seen chronia, but seems overkill for this feature (and is integrated with CVS only).
[1] http://stackoverflow.com/questions/30577090/how-to-export-fossil-scm-timelin...
As usual, any pointer on how to get this going will be greatly appreciated and I will give feedback to the community on how to do it.
Cheers,
Offray

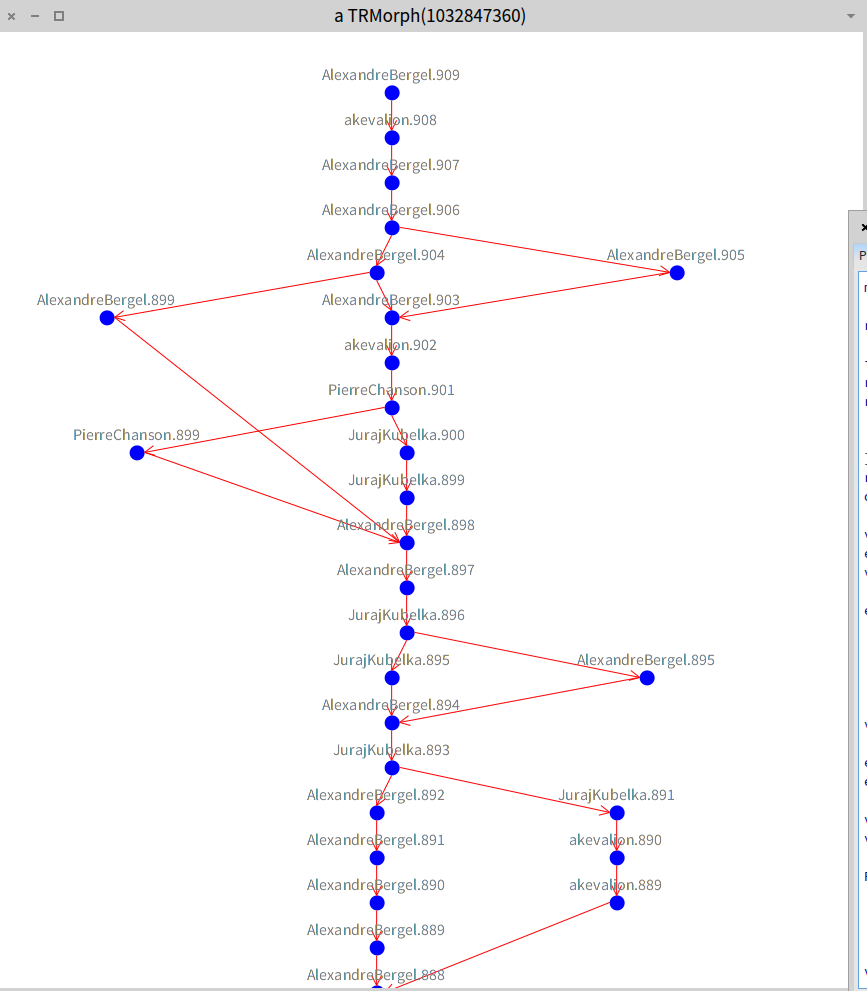
HI Offray, I gave it a quick bash and come up with the following code. It's just a prototype and could be greatly simplified. - MCVersionInfo ancestors for whatever reason returned empty array down the line (so its cut off at the end), but I didn't investigate the problem - edge building and possibly ancestor retrieval could be simplified with builders; I think RTMondrian has methods for it but can't remember exactly (agilevisualization mentioned RTGraphBuilder but that has been removed to my knowledge) ~~~~~~~~~~~~~~~ mc := MCSmalltalkhubRepository allInstances detect: [ :m | m project = 'Roassal2' ]. root := mc versionInfoFromFileNamed: mc readableFileNames first. family := Set new. retriever := nil. retriever := [ :child | family add: child. child ancestors do: [ :a | retriever value: a ] ]. retriever value: root. obs := family asGroup. v := RTView new. es := RTEllipse new size: 15; color: Color blue; elementsOn: obs. v addAll: es. edges := RTEdge buildEdgesFromObjects: obs from: #yourself toAll: #ancestors using: (RTArrowedLine new withShorterDistanceAttachPoint; color: Color red) scope: es. v addAll: edges. es @ RTDraggable. es @ (RTLabelled new text: [ :m | m nameWithout: 'Roassal2' ]). v @ RTDraggableView. v @ RTZoomableView. RTDominanceTreeLayout new verticalGap: 30; horizontalGap: 15; on: es. v open ~~~~~~~~~~~~~~~~ Cheers, Peter â On Tue, Jun 2, 2015 at 5:39 AM, Offray Vladimir Luna Cárdenas < offray@riseup.net> wrote:
Hi,
On a closer detail, seems that [1] contains the starting point I'm looking for. I'll keep you posted and of course any other approach will be listened.
[1] https://dl.dropboxusercontent.com/u/31543901/AgileVisualization/Roassal/0104...
Cheers,
Offray
On 01/06/15 22:04, Offray Vladimir Luna Cárdenas wrote:
Hi all,
I had asked a similar question before with no much advances, but today I made a discovery that can improve the things a lot: how to export timeline data as structured JSON [1] (and of course this open the possibility to work with it on Pharo). Now I would like to graph the data as a tree with forks, merges and dates and authors of commits. I have seen chronia, but seems overkill for this feature (and is integrated with CVS only).
[1] http://stackoverflow.com/questions/30577090/how-to-export-fossil-scm-timelin...
As usual, any pointer on how to get this going will be greatly appreciated and I will give feedback to the community on how to do it.
Cheers,
Offray

2015-06-02 12:09 GMT+02:00 Peter Uhnák <i.uhnak@gmail.com>:
HI Offray,
I gave it a quick bash and come up with the following code. It's just a prototype and could be greatly simplified.
- MCVersionInfo ancestors for whatever reason returned empty array down the line (so its cut off at the end), but I didn't investigate the problem
It's a Roassal packages issue. Last time I looked, history was cut at a certain point in most Roassal packages, but I don't know if this was done on purpose. Thierry
- edge building and possibly ancestor retrieval could be simplified with builders; I think RTMondrian has methods for it but can't remember exactly (agilevisualization mentioned RTGraphBuilder but that has been removed to my knowledge)
~~~~~~~~~~~~~~~ mc := MCSmalltalkhubRepository allInstances detect: [ :m | m project = 'Roassal2' ].
root := mc versionInfoFromFileNamed: mc readableFileNames first.
family := Set new. retriever := nil. retriever := [ :child | family add: child. child ancestors do: [ :a | retriever value: a ] ]. retriever value: root. obs := family asGroup.
v := RTView new. es := RTEllipse new size: 15; color: Color blue; elementsOn: obs. v addAll: es.
edges := RTEdge buildEdgesFromObjects: obs from: #yourself toAll: #ancestors using: (RTArrowedLine new withShorterDistanceAttachPoint; color: Color red) scope: es. v addAll: edges.
es @ RTDraggable. es @ (RTLabelled new text: [ :m | m nameWithout: 'Roassal2' ]).
v @ RTDraggableView. v @ RTZoomableView.
RTDominanceTreeLayout new verticalGap: 30; horizontalGap: 15; on: es.
v open ~~~~~~~~~~~~~~~~
Cheers, Peter
On Tue, Jun 2, 2015 at 5:39 AM, Offray Vladimir Luna Cárdenas < offray@riseup.net> wrote:
Hi,
On a closer detail, seems that [1] contains the starting point I'm looking for. I'll keep you posted and of course any other approach will be listened.
[1] https://dl.dropboxusercontent.com/u/31543901/AgileVisualization/Roassal/0104...
Cheers,
Offray
On 01/06/15 22:04, Offray Vladimir Luna Cárdenas wrote:
Hi all,
I had asked a similar question before with no much advances, but today I made a discovery that can improve the things a lot: how to export timeline data as structured JSON [1] (and of course this open the possibility to work with it on Pharo). Now I would like to graph the data as a tree with forks, merges and dates and authors of commits. I have seen chronia, but seems overkill for this feature (and is integrated with CVS only).
[1] http://stackoverflow.com/questions/30577090/how-to-export-fossil-scm-timelin...
As usual, any pointer on how to get this going will be greatly appreciated and I will give feedback to the community on how to do it.
Cheers,
Offray
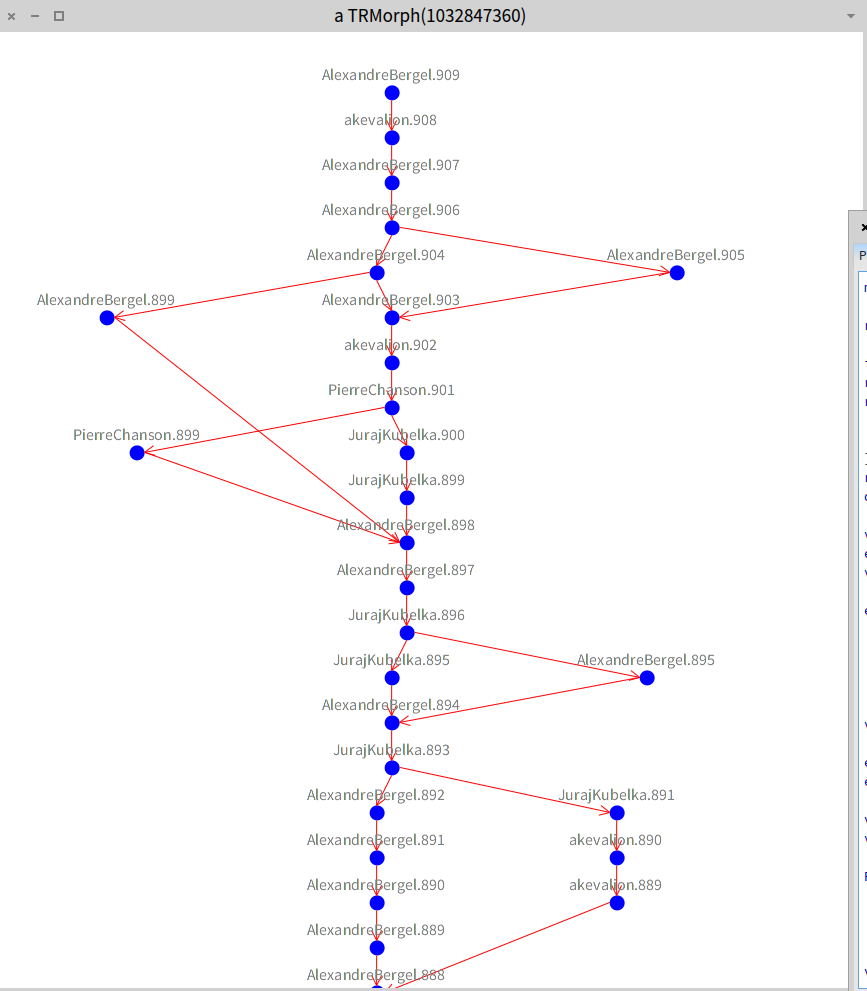

Interesting. The dominance tree layout is quite interesting for this use case. Doru On Tue, Jun 2, 2015 at 12:09 PM, Peter Uhnák <i.uhnak@gmail.com> wrote:
HI Offray,
I gave it a quick bash and come up with the following code. It's just a prototype and could be greatly simplified.
- MCVersionInfo ancestors for whatever reason returned empty array down the line (so its cut off at the end), but I didn't investigate the problem - edge building and possibly ancestor retrieval could be simplified with builders; I think RTMondrian has methods for it but can't remember exactly (agilevisualization mentioned RTGraphBuilder but that has been removed to my knowledge)
~~~~~~~~~~~~~~~ mc := MCSmalltalkhubRepository allInstances detect: [ :m | m project = 'Roassal2' ].
root := mc versionInfoFromFileNamed: mc readableFileNames first.
family := Set new. retriever := nil. retriever := [ :child | family add: child. child ancestors do: [ :a | retriever value: a ] ]. retriever value: root. obs := family asGroup.
v := RTView new. es := RTEllipse new size: 15; color: Color blue; elementsOn: obs. v addAll: es.
edges := RTEdge buildEdgesFromObjects: obs from: #yourself toAll: #ancestors using: (RTArrowedLine new withShorterDistanceAttachPoint; color: Color red) scope: es. v addAll: edges.
es @ RTDraggable. es @ (RTLabelled new text: [ :m | m nameWithout: 'Roassal2' ]).
v @ RTDraggableView. v @ RTZoomableView.
RTDominanceTreeLayout new verticalGap: 30; horizontalGap: 15; on: es.
v open ~~~~~~~~~~~~~~~~
Cheers, Peter â
On Tue, Jun 2, 2015 at 5:39 AM, Offray Vladimir Luna Cárdenas < offray@riseup.net> wrote:
Hi,
On a closer detail, seems that [1] contains the starting point I'm looking for. I'll keep you posted and of course any other approach will be listened.
[1] https://dl.dropboxusercontent.com/u/31543901/AgileVisualization/Roassal/0104...
Cheers,
Offray
On 01/06/15 22:04, Offray Vladimir Luna Cárdenas wrote:
Hi all,
I had asked a similar question before with no much advances, but today I made a discovery that can improve the things a lot: how to export timeline data as structured JSON [1] (and of course this open the possibility to work with it on Pharo). Now I would like to graph the data as a tree with forks, merges and dates and authors of commits. I have seen chronia, but seems overkill for this feature (and is integrated with CVS only).
[1] http://stackoverflow.com/questions/30577090/how-to-export-fossil-scm-timelin...
As usual, any pointer on how to get this going will be greatly appreciated and I will give feedback to the community on how to do it.
Cheers,
Offray
-- www.tudorgirba.com "Every thing has its own flow"
On Tue, Jun 2, 2015 at 3:07 PM, Tudor Girba <tudor@tudorgirba.com> wrote:
Interesting. The dominance tree layout is quite interesting for this use case.
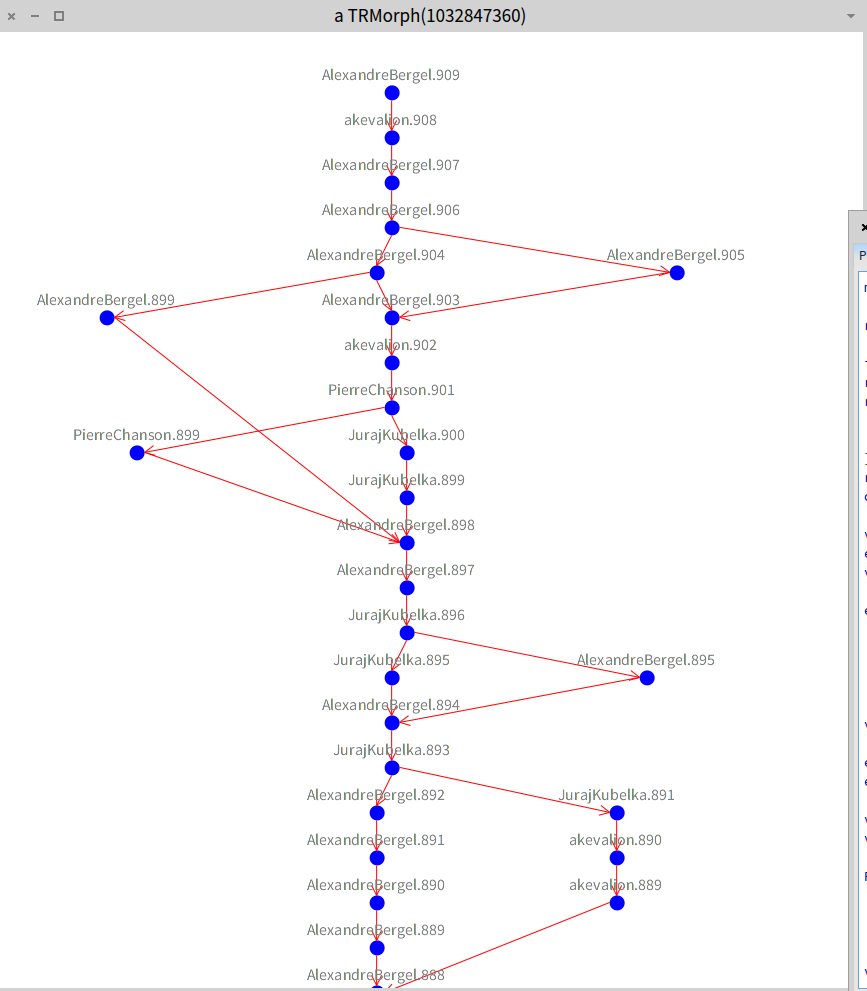
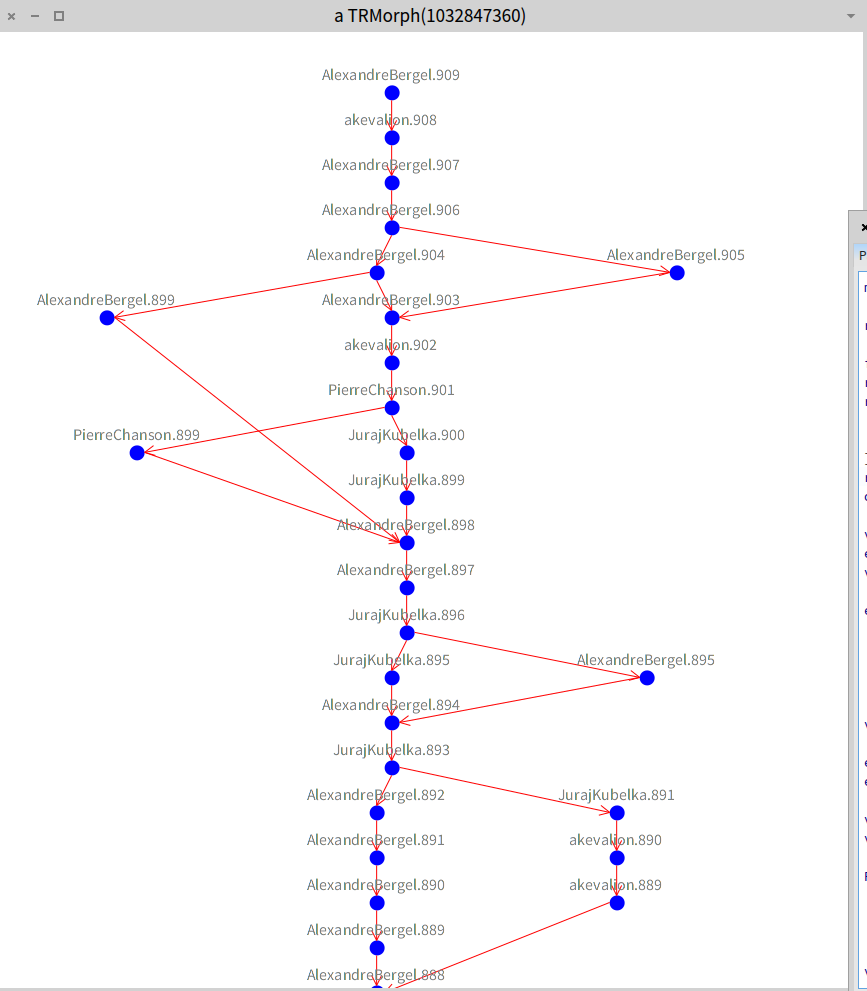
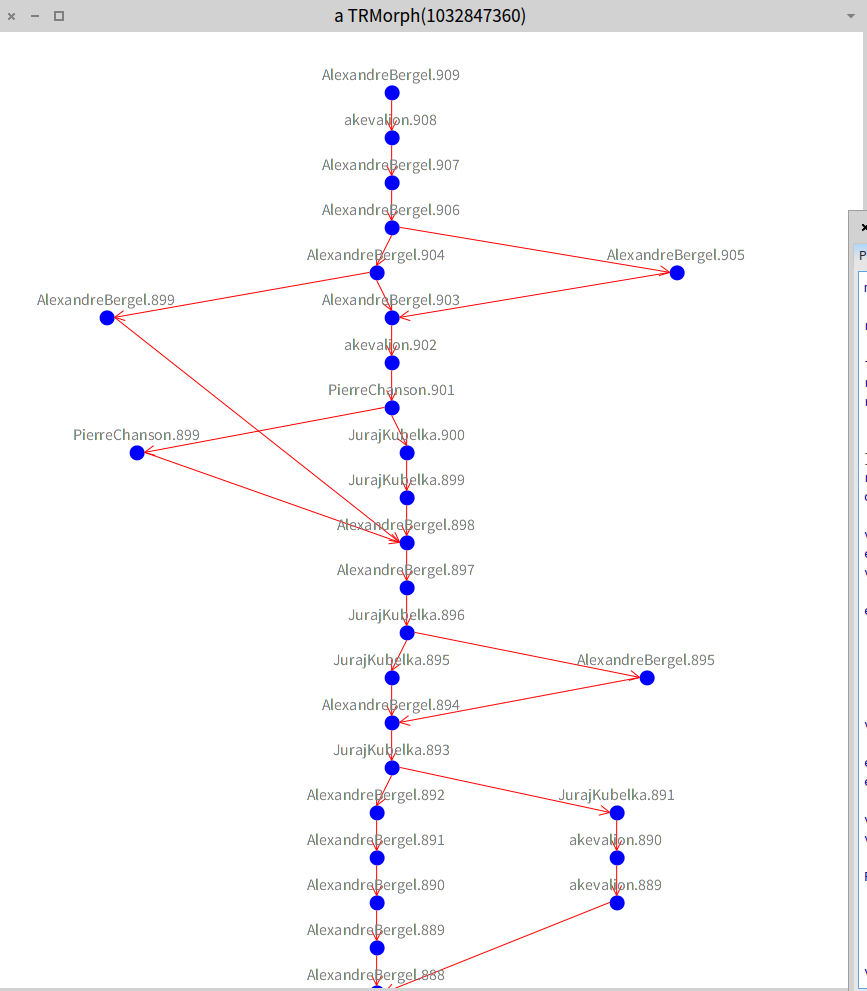
There were some upward lines at the bottom of the graph for no apparent reason, not sure what was going on there yet, so I'll look into the layout when I have more time. Alternatively you could also use Sugiyama, however either due to the choice of heuristics, or some bug it places high priority on last levels which is really bad (since it is no longer at proper hierarchical layers). Peter
Doru
On Tue, Jun 2, 2015 at 12:09 PM, Peter Uhnák <i.uhnak@gmail.com> wrote:
HI Offray,
I gave it a quick bash and come up with the following code. It's just a prototype and could be greatly simplified.
- MCVersionInfo ancestors for whatever reason returned empty array down the line (so its cut off at the end), but I didn't investigate the problem - edge building and possibly ancestor retrieval could be simplified with builders; I think RTMondrian has methods for it but can't remember exactly (agilevisualization mentioned RTGraphBuilder but that has been removed to my knowledge)
~~~~~~~~~~~~~~~ mc := MCSmalltalkhubRepository allInstances detect: [ :m | m project = 'Roassal2' ].
root := mc versionInfoFromFileNamed: mc readableFileNames first.
family := Set new. retriever := nil. retriever := [ :child | family add: child. child ancestors do: [ :a | retriever value: a ] ]. retriever value: root. obs := family asGroup.
v := RTView new. es := RTEllipse new size: 15; color: Color blue; elementsOn: obs. v addAll: es.
edges := RTEdge buildEdgesFromObjects: obs from: #yourself toAll: #ancestors using: (RTArrowedLine new withShorterDistanceAttachPoint; color: Color red) scope: es. v addAll: edges.
es @ RTDraggable. es @ (RTLabelled new text: [ :m | m nameWithout: 'Roassal2' ]).
v @ RTDraggableView. v @ RTZoomableView.
RTDominanceTreeLayout new verticalGap: 30; horizontalGap: 15; on: es.
v open ~~~~~~~~~~~~~~~~
Cheers, Peter â
On Tue, Jun 2, 2015 at 5:39 AM, Offray Vladimir Luna Cárdenas < offray@riseup.net> wrote:
Hi,
On a closer detail, seems that [1] contains the starting point I'm looking for. I'll keep you posted and of course any other approach will be listened.
[1] https://dl.dropboxusercontent.com/u/31543901/AgileVisualization/Roassal/0104...
Cheers,
Offray
On 01/06/15 22:04, Offray Vladimir Luna Cárdenas wrote:
Hi all,
I had asked a similar question before with no much advances, but today I made a discovery that can improve the things a lot: how to export timeline data as structured JSON [1] (and of course this open the possibility to work with it on Pharo). Now I would like to graph the data as a tree with forks, merges and dates and authors of commits. I have seen chronia, but seems overkill for this feature (and is integrated with CVS only).
[1] http://stackoverflow.com/questions/30577090/how-to-export-fossil-scm-timelin...
As usual, any pointer on how to get this going will be greatly appreciated and I will give feedback to the community on how to do it.
Cheers,
Offray
-- www.tudorgirba.com
"Every thing has its own flow"
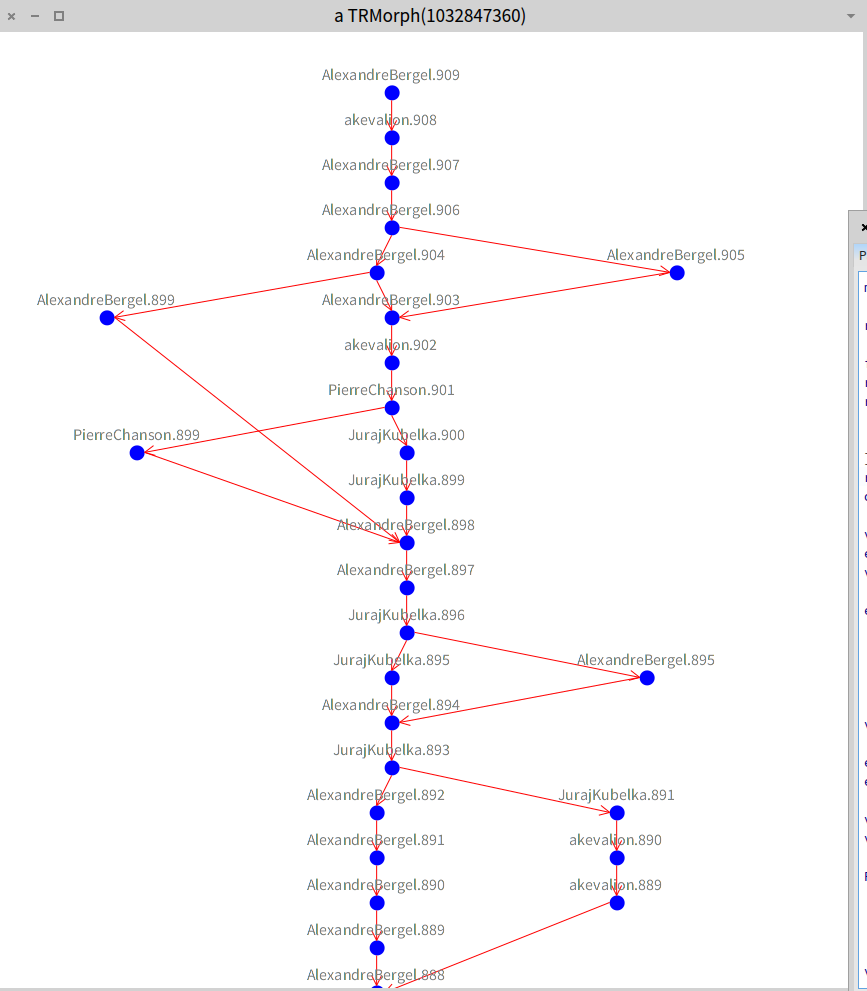

Interesting visualization! Keep going! Alexandre -- _,.;:~^~:;._,.;:~^~:;._,.;:~^~:;._,.;:~^~:;._,.;: Alexandre Bergel http://www.bergel.eu ^~:;._,.;:~^~:;._,.;:~^~:;._,.;:~^~:;._,.;:~^~:;.
On Jun 2, 2015, at 10:57 AM, Peter Uhnák <i.uhnak@gmail.com> wrote:
On Tue, Jun 2, 2015 at 3:07 PM, Tudor Girba <tudor@tudorgirba.com <mailto:tudor@tudorgirba.com>> wrote: Interesting. The dominance tree layout is quite interesting for this use case.
There were some upward lines at the bottom of the graph for no apparent reason, not sure what was going on there yet, so I'll look into the layout when I have more time.
Alternatively you could also use Sugiyama, however either due to the choice of heuristics, or some bug it places high priority on last levels which is really bad (since it is no longer at proper hierarchical layers).
Peter
Doru
On Tue, Jun 2, 2015 at 12:09 PM, Peter Uhnák <i.uhnak@gmail.com <mailto:i.uhnak@gmail.com>> wrote: HI Offray,
I gave it a quick bash and come up with the following code. It's just a prototype and could be greatly simplified.
- MCVersionInfo ancestors for whatever reason returned empty array down the line (so its cut off at the end), but I didn't investigate the problem - edge building and possibly ancestor retrieval could be simplified with builders; I think RTMondrian has methods for it but can't remember exactly (agilevisualization mentioned RTGraphBuilder but that has been removed to my knowledge)
~~~~~~~~~~~~~~~ mc := MCSmalltalkhubRepository allInstances detect: [ :m | m project = 'Roassal2' ].
root := mc versionInfoFromFileNamed: mc readableFileNames first.
family := Set new. retriever := nil. retriever := [ :child | family add: child. child ancestors do: [ :a | retriever value: a ] ]. retriever value: root. obs := family asGroup.
v := RTView new. es := RTEllipse new size: 15; color: Color blue; elementsOn: obs. v addAll: es.
edges := RTEdge buildEdgesFromObjects: obs from: #yourself toAll: #ancestors using: (RTArrowedLine new withShorterDistanceAttachPoint; color: Color red) scope: es. v addAll: edges.
es @ RTDraggable. es @ (RTLabelled new text: [ :m | m nameWithout: 'Roassal2' ]).
v @ RTDraggableView. v @ RTZoomableView.
RTDominanceTreeLayout new verticalGap: 30; horizontalGap: 15; on: es.
v open ~~~~~~~~~~~~~~~~
<2015-06-02_12:04:32.png>
Cheers, Peter â
On Tue, Jun 2, 2015 at 5:39 AM, Offray Vladimir Luna Cárdenas <offray@riseup.net <mailto:offray@riseup.net>> wrote: Hi,
On a closer detail, seems that [1] contains the starting point I'm looking for. I'll keep you posted and of course any other approach will be listened.
[1] https://dl.dropboxusercontent.com/u/31543901/AgileVisualization/Roassal/0104... <https://dl.dropboxusercontent.com/u/31543901/AgileVisualization/Roassal/0104...>
Cheers,
Offray
On 01/06/15 22:04, Offray Vladimir Luna Cárdenas wrote: Hi all,
I had asked a similar question before with no much advances, but today I made a discovery that can improve the things a lot: how to export timeline data as structured JSON [1] (and of course this open the possibility to work with it on Pharo). Now I would like to graph the data as a tree with forks, merges and dates and authors of commits. I have seen chronia, but seems overkill for this feature (and is integrated with CVS only).
[1] http://stackoverflow.com/questions/30577090/how-to-export-fossil-scm-timelin... <http://stackoverflow.com/questions/30577090/how-to-export-fossil-scm-timelin...>
As usual, any pointer on how to get this going will be greatly appreciated and I will give feedback to the community on how to do it.
Cheers,
Offray
-- www.tudorgirba.com <http://www.tudorgirba.com/>
"Every thing has its own flow"
Omg I just found out that if I click on the node representing an McVersionInfo it actually opens it in the inspector and I didn't even needed to implement anything special. That's really cool! Peter On Tue, Jun 2, 2015 at 6:59 PM, Alexandre Bergel <alexandre.bergel@me.com> wrote:
Interesting visualization! Keep going!
Alexandre -- _,.;:~^~:;._,.;:~^~:;._,.;:~^~:;._,.;:~^~:;._,.;: Alexandre Bergel http://www.bergel.eu ^~:;._,.;:~^~:;._,.;:~^~:;._,.;:~^~:;._,.;:~^~:;.
On Jun 2, 2015, at 10:57 AM, Peter Uhnák <i.uhnak@gmail.com> wrote:
On Tue, Jun 2, 2015 at 3:07 PM, Tudor Girba <tudor@tudorgirba.com> wrote:
Interesting. The dominance tree layout is quite interesting for this use case.
There were some upward lines at the bottom of the graph for no apparent reason, not sure what was going on there yet, so I'll look into the layout when I have more time.
Alternatively you could also use Sugiyama, however either due to the choice of heuristics, or some bug it places high priority on last levels which is really bad (since it is no longer at proper hierarchical layers).
Peter
Doru
On Tue, Jun 2, 2015 at 12:09 PM, Peter Uhnák <i.uhnak@gmail.com> wrote:
HI Offray,
I gave it a quick bash and come up with the following code. It's just a prototype and could be greatly simplified.
- MCVersionInfo ancestors for whatever reason returned empty array down the line (so its cut off at the end), but I didn't investigate the problem - edge building and possibly ancestor retrieval could be simplified with builders; I think RTMondrian has methods for it but can't remember exactly (agilevisualization mentioned RTGraphBuilder but that has been removed to my knowledge)
~~~~~~~~~~~~~~~ mc := MCSmalltalkhubRepository allInstances detect: [ :m | m project = 'Roassal2' ].
root := mc versionInfoFromFileNamed: mc readableFileNames first.
family := Set new. retriever := nil. retriever := [ :child | family add: child. child ancestors do: [ :a | retriever value: a ] ]. retriever value: root. obs := family asGroup.
v := RTView new. es := RTEllipse new size: 15; color: Color blue; elementsOn: obs. v addAll: es.
edges := RTEdge buildEdgesFromObjects: obs from: #yourself toAll: #ancestors using: (RTArrowedLine new withShorterDistanceAttachPoint; color: Color red) scope: es. v addAll: edges.
es @ RTDraggable. es @ (RTLabelled new text: [ :m | m nameWithout: 'Roassal2' ]).
v @ RTDraggableView. v @ RTZoomableView.
RTDominanceTreeLayout new verticalGap: 30; horizontalGap: 15; on: es.
v open ~~~~~~~~~~~~~~~~
<2015-06-02_12:04:32.png>
Cheers, Peter â
On Tue, Jun 2, 2015 at 5:39 AM, Offray Vladimir Luna Cárdenas < offray@riseup.net> wrote:
Hi,
On a closer detail, seems that [1] contains the starting point I'm looking for. I'll keep you posted and of course any other approach will be listened.
[1] https://dl.dropboxusercontent.com/u/31543901/AgileVisualization/Roassal/0104...
Cheers,
Offray
On 01/06/15 22:04, Offray Vladimir Luna Cárdenas wrote:
Hi all,
I had asked a similar question before with no much advances, but today I made a discovery that can improve the things a lot: how to export timeline data as structured JSON [1] (and of course this open the possibility to work with it on Pharo). Now I would like to graph the data as a tree with forks, merges and dates and authors of commits. I have seen chronia, but seems overkill for this feature (and is integrated with CVS only).
[1] http://stackoverflow.com/questions/30577090/how-to-export-fossil-scm-timelin...
As usual, any pointer on how to get this going will be greatly appreciated and I will give feedback to the community on how to do it.
Cheers,
Offray
-- www.tudorgirba.com
"Every thing has its own flow"
You mean that when you click on a node while you inspecting the view you get a new pane to the right with that object? Doru On Thu, Jun 4, 2015 at 7:16 PM, Peter Uhnák <i.uhnak@gmail.com> wrote:
Omg I just found out that if I click on the node representing an McVersionInfo it actually opens it in the inspector and I didn't even needed to implement anything special. That's really cool!
Peter
On Tue, Jun 2, 2015 at 6:59 PM, Alexandre Bergel <alexandre.bergel@me.com> wrote:
Interesting visualization! Keep going!
Alexandre -- _,.;:~^~:;._,.;:~^~:;._,.;:~^~:;._,.;:~^~:;._,.;: Alexandre Bergel http://www.bergel.eu ^~:;._,.;:~^~:;._,.;:~^~:;._,.;:~^~:;._,.;:~^~:;.
On Jun 2, 2015, at 10:57 AM, Peter Uhnák <i.uhnak@gmail.com> wrote:
On Tue, Jun 2, 2015 at 3:07 PM, Tudor Girba <tudor@tudorgirba.com> wrote:
Interesting. The dominance tree layout is quite interesting for this use case.
There were some upward lines at the bottom of the graph for no apparent reason, not sure what was going on there yet, so I'll look into the layout when I have more time.
Alternatively you could also use Sugiyama, however either due to the choice of heuristics, or some bug it places high priority on last levels which is really bad (since it is no longer at proper hierarchical layers).
Peter
Doru
On Tue, Jun 2, 2015 at 12:09 PM, Peter Uhnák <i.uhnak@gmail.com> wrote:
HI Offray,
I gave it a quick bash and come up with the following code. It's just a prototype and could be greatly simplified.
- MCVersionInfo ancestors for whatever reason returned empty array down the line (so its cut off at the end), but I didn't investigate the problem - edge building and possibly ancestor retrieval could be simplified with builders; I think RTMondrian has methods for it but can't remember exactly (agilevisualization mentioned RTGraphBuilder but that has been removed to my knowledge)
~~~~~~~~~~~~~~~ mc := MCSmalltalkhubRepository allInstances detect: [ :m | m project = 'Roassal2' ].
root := mc versionInfoFromFileNamed: mc readableFileNames first.
family := Set new. retriever := nil. retriever := [ :child | family add: child. child ancestors do: [ :a | retriever value: a ] ]. retriever value: root. obs := family asGroup.
v := RTView new. es := RTEllipse new size: 15; color: Color blue; elementsOn: obs. v addAll: es.
edges := RTEdge buildEdgesFromObjects: obs from: #yourself toAll: #ancestors using: (RTArrowedLine new withShorterDistanceAttachPoint; color: Color red) scope: es. v addAll: edges.
es @ RTDraggable. es @ (RTLabelled new text: [ :m | m nameWithout: 'Roassal2' ]).
v @ RTDraggableView. v @ RTZoomableView.
RTDominanceTreeLayout new verticalGap: 30; horizontalGap: 15; on: es.
v open ~~~~~~~~~~~~~~~~
<2015-06-02_12:04:32.png>
Cheers, Peter â
On Tue, Jun 2, 2015 at 5:39 AM, Offray Vladimir Luna Cárdenas < offray@riseup.net> wrote:
Hi,
On a closer detail, seems that [1] contains the starting point I'm looking for. I'll keep you posted and of course any other approach will be listened.
[1] https://dl.dropboxusercontent.com/u/31543901/AgileVisualization/Roassal/0104...
Cheers,
Offray
On 01/06/15 22:04, Offray Vladimir Luna Cárdenas wrote:
Hi all,
I had asked a similar question before with no much advances, but today I made a discovery that can improve the things a lot: how to export timeline data as structured JSON [1] (and of course this open the possibility to work with it on Pharo). Now I would like to graph the data as a tree with forks, merges and dates and authors of commits. I have seen chronia, but seems overkill for this feature (and is integrated with CVS only).
[1] http://stackoverflow.com/questions/30577090/how-to-export-fossil-scm-timelin...
As usual, any pointer on how to get this going will be greatly appreciated and I will give feedback to the community on how to do it.
Cheers,
Offray
-- www.tudorgirba.com
"Every thing has its own flow"
-- www.tudorgirba.com "Every thing has its own flow"
Yeah, this thing. :) I mean I knew I could program it, but I was just surprised that it did it automatically, which is cool :) Peter â On Thu, Jun 4, 2015 at 9:54 PM, Tudor Girba <tudor@tudorgirba.com> wrote:
You mean that when you click on a node while you inspecting the view you get a new pane to the right with that object?
Doru
On Thu, Jun 4, 2015 at 7:16 PM, Peter Uhnák <i.uhnak@gmail.com> wrote:
Omg I just found out that if I click on the node representing an McVersionInfo it actually opens it in the inspector and I didn't even needed to implement anything special. That's really cool!
Peter
On Tue, Jun 2, 2015 at 6:59 PM, Alexandre Bergel <alexandre.bergel@me.com
wrote:
Interesting visualization! Keep going!
Alexandre -- _,.;:~^~:;._,.;:~^~:;._,.;:~^~:;._,.;:~^~:;._,.;: Alexandre Bergel http://www.bergel.eu ^~:;._,.;:~^~:;._,.;:~^~:;._,.;:~^~:;._,.;:~^~:;.
On Jun 2, 2015, at 10:57 AM, Peter Uhnák <i.uhnak@gmail.com> wrote:
On Tue, Jun 2, 2015 at 3:07 PM, Tudor Girba <tudor@tudorgirba.com> wrote:
Interesting. The dominance tree layout is quite interesting for this use case.
There were some upward lines at the bottom of the graph for no apparent reason, not sure what was going on there yet, so I'll look into the layout when I have more time.
Alternatively you could also use Sugiyama, however either due to the choice of heuristics, or some bug it places high priority on last levels which is really bad (since it is no longer at proper hierarchical layers).
Peter
Doru
On Tue, Jun 2, 2015 at 12:09 PM, Peter Uhnák <i.uhnak@gmail.com> wrote:
HI Offray,
I gave it a quick bash and come up with the following code. It's just a prototype and could be greatly simplified.
- MCVersionInfo ancestors for whatever reason returned empty array down the line (so its cut off at the end), but I didn't investigate the problem - edge building and possibly ancestor retrieval could be simplified with builders; I think RTMondrian has methods for it but can't remember exactly (agilevisualization mentioned RTGraphBuilder but that has been removed to my knowledge)
~~~~~~~~~~~~~~~ mc := MCSmalltalkhubRepository allInstances detect: [ :m | m project = 'Roassal2' ].
root := mc versionInfoFromFileNamed: mc readableFileNames first.
family := Set new. retriever := nil. retriever := [ :child | family add: child. child ancestors do: [ :a | retriever value: a ] ]. retriever value: root. obs := family asGroup.
v := RTView new. es := RTEllipse new size: 15; color: Color blue; elementsOn: obs. v addAll: es.
edges := RTEdge buildEdgesFromObjects: obs from: #yourself toAll: #ancestors using: (RTArrowedLine new withShorterDistanceAttachPoint; color: Color red) scope: es. v addAll: edges.
es @ RTDraggable. es @ (RTLabelled new text: [ :m | m nameWithout: 'Roassal2' ]).
v @ RTDraggableView. v @ RTZoomableView.
RTDominanceTreeLayout new verticalGap: 30; horizontalGap: 15; on: es.
v open ~~~~~~~~~~~~~~~~
<2015-06-02_12:04:32.png>
Cheers, Peter â
On Tue, Jun 2, 2015 at 5:39 AM, Offray Vladimir Luna Cárdenas < offray@riseup.net> wrote:
Hi,
On a closer detail, seems that [1] contains the starting point I'm looking for. I'll keep you posted and of course any other approach will be listened.
[1] https://dl.dropboxusercontent.com/u/31543901/AgileVisualization/Roassal/0104...
Cheers,
Offray
On 01/06/15 22:04, Offray Vladimir Luna Cárdenas wrote:
Hi all,
I had asked a similar question before with no much advances, but today I made a discovery that can improve the things a lot: how to export timeline data as structured JSON [1] (and of course this open the possibility to work with it on Pharo). Now I would like to graph the data as a tree with forks, merges and dates and authors of commits. I have seen chronia, but seems overkill for this feature (and is integrated with CVS only).
[1] http://stackoverflow.com/questions/30577090/how-to-export-fossil-scm-timelin...
As usual, any pointer on how to get this going will be greatly appreciated and I will give feedback to the community on how to do it.
Cheers,
Offray
-- www.tudorgirba.com
"Every thing has its own flow"
-- www.tudorgirba.com
"Every thing has its own flow"
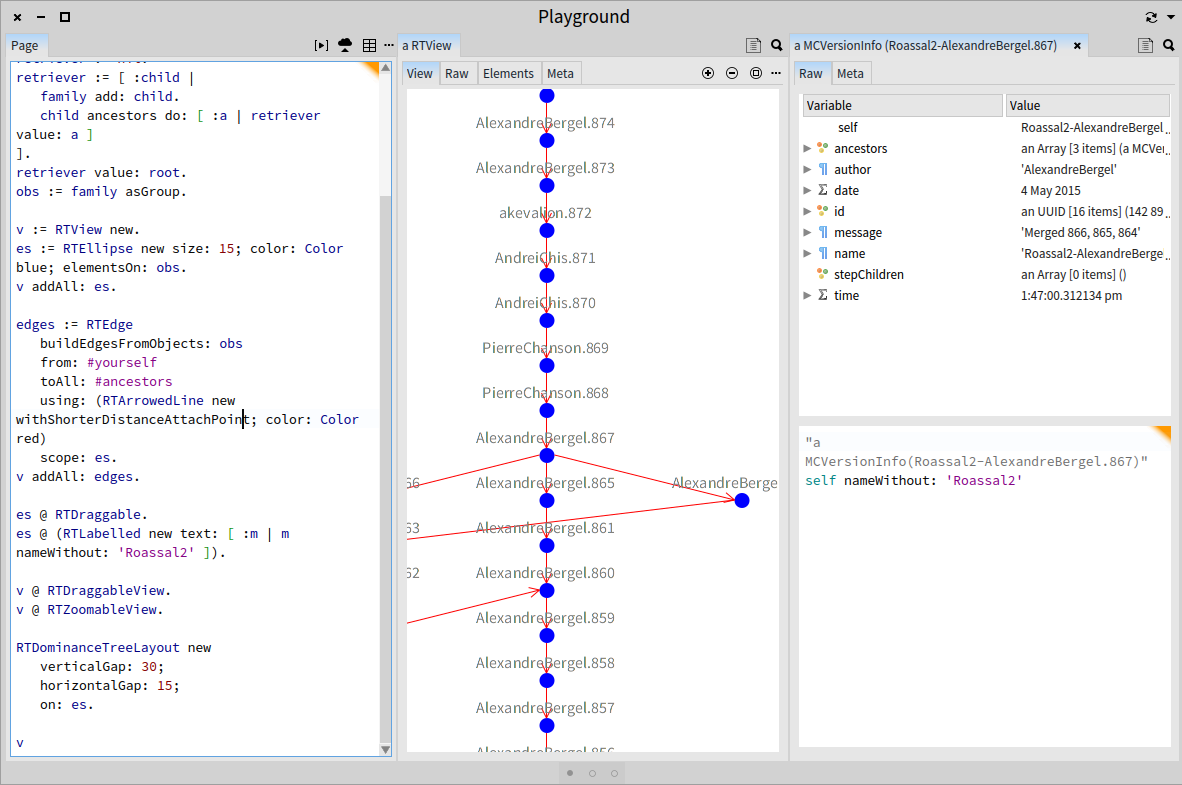
Objects are magical :) Doru On Thu, Jun 4, 2015 at 10:04 PM, Peter Uhnák <i.uhnak@gmail.com> wrote:
Yeah, this thing. :)
I mean I knew I could program it, but I was just surprised that it did it automatically, which is cool :)
Peter â
On Thu, Jun 4, 2015 at 9:54 PM, Tudor Girba <tudor@tudorgirba.com> wrote:
You mean that when you click on a node while you inspecting the view you get a new pane to the right with that object?
Doru
On Thu, Jun 4, 2015 at 7:16 PM, Peter Uhnák <i.uhnak@gmail.com> wrote:
Omg I just found out that if I click on the node representing an McVersionInfo it actually opens it in the inspector and I didn't even needed to implement anything special. That's really cool!
Peter
On Tue, Jun 2, 2015 at 6:59 PM, Alexandre Bergel < alexandre.bergel@me.com> wrote:
Interesting visualization! Keep going!
Alexandre -- _,.;:~^~:;._,.;:~^~:;._,.;:~^~:;._,.;:~^~:;._,.;: Alexandre Bergel http://www.bergel.eu ^~:;._,.;:~^~:;._,.;:~^~:;._,.;:~^~:;._,.;:~^~:;.
On Jun 2, 2015, at 10:57 AM, Peter Uhnák <i.uhnak@gmail.com> wrote:
On Tue, Jun 2, 2015 at 3:07 PM, Tudor Girba <tudor@tudorgirba.com> wrote:
Interesting. The dominance tree layout is quite interesting for this use case.
There were some upward lines at the bottom of the graph for no apparent reason, not sure what was going on there yet, so I'll look into the layout when I have more time.
Alternatively you could also use Sugiyama, however either due to the choice of heuristics, or some bug it places high priority on last levels which is really bad (since it is no longer at proper hierarchical layers).
Peter
Doru
On Tue, Jun 2, 2015 at 12:09 PM, Peter Uhnák <i.uhnak@gmail.com> wrote:
HI Offray,
I gave it a quick bash and come up with the following code. It's just a prototype and could be greatly simplified.
- MCVersionInfo ancestors for whatever reason returned empty array down the line (so its cut off at the end), but I didn't investigate the problem - edge building and possibly ancestor retrieval could be simplified with builders; I think RTMondrian has methods for it but can't remember exactly (agilevisualization mentioned RTGraphBuilder but that has been removed to my knowledge)
~~~~~~~~~~~~~~~ mc := MCSmalltalkhubRepository allInstances detect: [ :m | m project = 'Roassal2' ].
root := mc versionInfoFromFileNamed: mc readableFileNames first.
family := Set new. retriever := nil. retriever := [ :child | family add: child. child ancestors do: [ :a | retriever value: a ] ]. retriever value: root. obs := family asGroup.
v := RTView new. es := RTEllipse new size: 15; color: Color blue; elementsOn: obs. v addAll: es.
edges := RTEdge buildEdgesFromObjects: obs from: #yourself toAll: #ancestors using: (RTArrowedLine new withShorterDistanceAttachPoint; color: Color red) scope: es. v addAll: edges.
es @ RTDraggable. es @ (RTLabelled new text: [ :m | m nameWithout: 'Roassal2' ]).
v @ RTDraggableView. v @ RTZoomableView.
RTDominanceTreeLayout new verticalGap: 30; horizontalGap: 15; on: es.
v open ~~~~~~~~~~~~~~~~
<2015-06-02_12:04:32.png>
Cheers, Peter â
On Tue, Jun 2, 2015 at 5:39 AM, Offray Vladimir Luna Cárdenas < offray@riseup.net> wrote:
Hi,
On a closer detail, seems that [1] contains the starting point I'm looking for. I'll keep you posted and of course any other approach will be listened.
[1] https://dl.dropboxusercontent.com/u/31543901/AgileVisualization/Roassal/0104...
Cheers,
Offray
On 01/06/15 22:04, Offray Vladimir Luna Cárdenas wrote:
Hi all,
I had asked a similar question before with no much advances, but today I made a discovery that can improve the things a lot: how to export timeline data as structured JSON [1] (and of course this open the possibility to work with it on Pharo). Now I would like to graph the data as a tree with forks, merges and dates and authors of commits. I have seen chronia, but seems overkill for this feature (and is integrated with CVS only).
[1] http://stackoverflow.com/questions/30577090/how-to-export-fossil-scm-timelin...
As usual, any pointer on how to get this going will be greatly appreciated and I will give feedback to the community on how to do it.
Cheers,
Offray
-- www.tudorgirba.com
"Every thing has its own flow"
-- www.tudorgirba.com
"Every thing has its own flow"
-- www.tudorgirba.com "Every thing has its own flow"
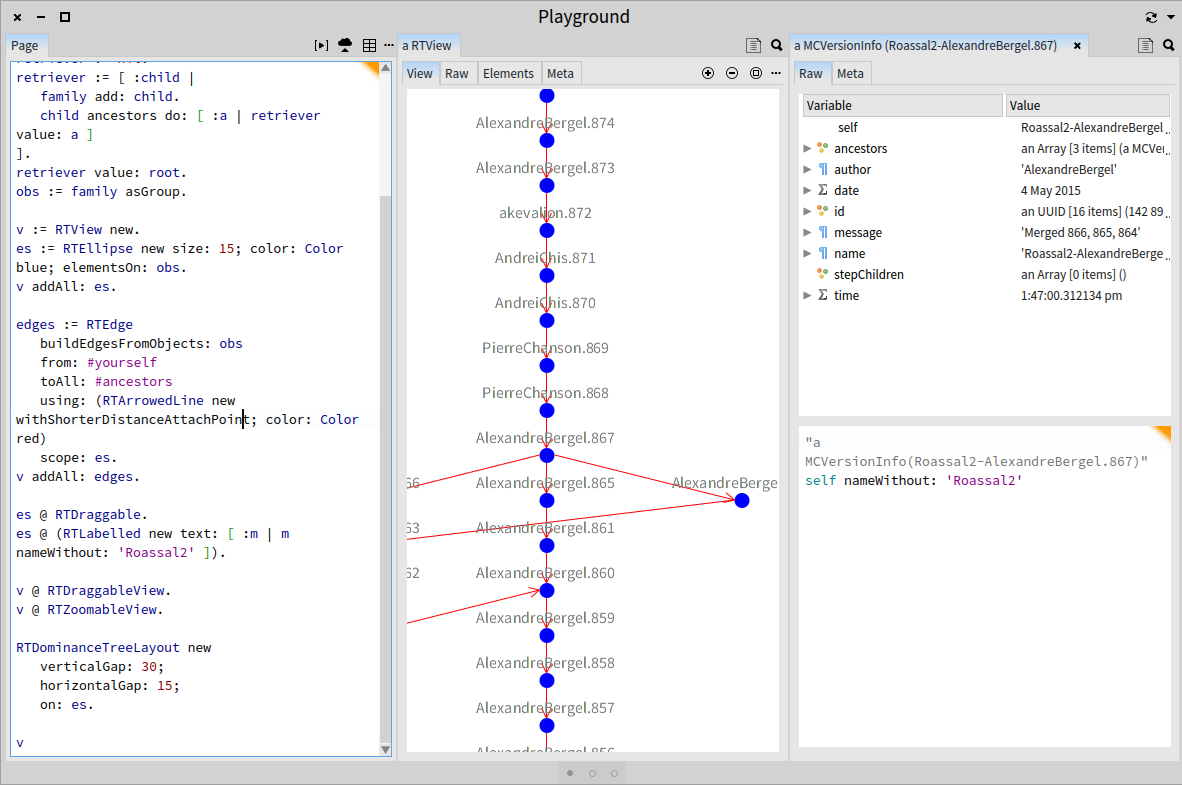
Objects are magical :)
Yes, and this is absolutely mind blowing. Understanding that a mouse click is most of the time an action to inspect is absolutely a step forward. I feel we are still at the very beginning. It would be nice to see how this will evolve over the time... Alexandre
On Thu, Jun 4, 2015 at 10:04 PM, Peter Uhnák <i.uhnak@gmail.com> wrote: Yeah, this thing. :)
<2015-06-04_22:02:31.png>
I mean I knew I could program it, but I was just surprised that it did it automatically, which is cool :)
Peter â
On Thu, Jun 4, 2015 at 9:54 PM, Tudor Girba <tudor@tudorgirba.com> wrote: You mean that when you click on a node while you inspecting the view you get a new pane to the right with that object?
Doru
On Thu, Jun 4, 2015 at 7:16 PM, Peter Uhnák <i.uhnak@gmail.com> wrote: Omg I just found out that if I click on the node representing an McVersionInfo it actually opens it in the inspector and I didn't even needed to implement anything special. That's really cool!
Peter
On Tue, Jun 2, 2015 at 6:59 PM, Alexandre Bergel <alexandre.bergel@me.com> wrote: Interesting visualization! Keep going!
Alexandre -- _,.;:~^~:;._,.;:~^~:;._,.;:~^~:;._,.;:~^~:;._,.;: Alexandre Bergel http://www.bergel.eu ^~:;._,.;:~^~:;._,.;:~^~:;._,.;:~^~:;._,.;:~^~:;.
On Jun 2, 2015, at 10:57 AM, Peter Uhnák <i.uhnak@gmail.com> wrote:
On Tue, Jun 2, 2015 at 3:07 PM, Tudor Girba <tudor@tudorgirba.com> wrote: Interesting. The dominance tree layout is quite interesting for this use case.
There were some upward lines at the bottom of the graph for no apparent reason, not sure what was going on there yet, so I'll look into the layout when I have more time.
Alternatively you could also use Sugiyama, however either due to the choice of heuristics, or some bug it places high priority on last levels which is really bad (since it is no longer at proper hierarchical layers).
Peter
Doru
On Tue, Jun 2, 2015 at 12:09 PM, Peter Uhnák <i.uhnak@gmail.com> wrote: HI Offray,
I gave it a quick bash and come up with the following code. It's just a prototype and could be greatly simplified.
- MCVersionInfo ancestors for whatever reason returned empty array down the line (so its cut off at the end), but I didn't investigate the problem - edge building and possibly ancestor retrieval could be simplified with builders; I think RTMondrian has methods for it but can't remember exactly (agilevisualization mentioned RTGraphBuilder but that has been removed to my knowledge)
~~~~~~~~~~~~~~~ mc := MCSmalltalkhubRepository allInstances detect: [ :m | m project = 'Roassal2' ].
root := mc versionInfoFromFileNamed: mc readableFileNames first.
family := Set new. retriever := nil. retriever := [ :child | family add: child. child ancestors do: [ :a | retriever value: a ] ]. retriever value: root. obs := family asGroup.
v := RTView new. es := RTEllipse new size: 15; color: Color blue; elementsOn: obs. v addAll: es.
edges := RTEdge buildEdgesFromObjects: obs from: #yourself toAll: #ancestors using: (RTArrowedLine new withShorterDistanceAttachPoint; color: Color red) scope: es. v addAll: edges.
es @ RTDraggable. es @ (RTLabelled new text: [ :m | m nameWithout: 'Roassal2' ]).
v @ RTDraggableView. v @ RTZoomableView.
RTDominanceTreeLayout new verticalGap: 30; horizontalGap: 15; on: es.
v open ~~~~~~~~~~~~~~~~
<2015-06-02_12:04:32.png>
Cheers, Peter â
On Tue, Jun 2, 2015 at 5:39 AM, Offray Vladimir Luna Cárdenas <offray@riseup.net> wrote: Hi,
On a closer detail, seems that [1] contains the starting point I'm looking for. I'll keep you posted and of course any other approach will be listened.
[1] https://dl.dropboxusercontent.com/u/31543901/AgileVisualization/Roassal/0104...
Cheers,
Offray
On 01/06/15 22:04, Offray Vladimir Luna Cárdenas wrote: Hi all,
I had asked a similar question before with no much advances, but today I made a discovery that can improve the things a lot: how to export timeline data as structured JSON [1] (and of course this open the possibility to work with it on Pharo). Now I would like to graph the data as a tree with forks, merges and dates and authors of commits. I have seen chronia, but seems overkill for this feature (and is integrated with CVS only).
[1] http://stackoverflow.com/questions/30577090/how-to-export-fossil-scm-timelin...
As usual, any pointer on how to get this going will be greatly appreciated and I will give feedback to the community on how to do it.
Cheers,
Offray
-- www.tudorgirba.com
"Every thing has its own flow"
-- www.tudorgirba.com
"Every thing has its own flow"
-- www.tudorgirba.com
"Every thing has its own flow"
-- _,.;:~^~:;._,.;:~^~:;._,.;:~^~:;._,.;:~^~:;._,.;: Alexandre Bergel http://www.bergel.eu ^~:;._,.;:~^~:;._,.;:~^~:;._,.;:~^~:;._,.;:~^~:;.
Hi Peter, Thanks for your quick answer. I was pretty curious about trying to implement some of this ideas, but only until today I had the proper time to do it. I ran your code and now I'm trying to translate the ideas on it to my problem: Drawing a tree for the story of a fossil repository. First, using the procedure at [1] I was able to export a fossil commit repo history as Json and by running the script at [2] I was able to get a small set of dots, which represent dictionaries with all commit data, including ancestors for each node, like the attached screenshot shows. In the video at [3] at 1:06 min, seems that lays the key for my visualization, but for that I need to create a fossil commit object that can understand the #ancestor message. Because I already have them as dictionaries thanks to NeoJson, seems that I'm really close to get the visualization I'm looking for. I hope to work on it this morning and return to the list with data visualizations or more questions. [1] http://stackoverflow.com/questions/30577090/how-to-export-fossil-scm-timelin... [2] http://ws.stfx.eu/A5C8JJMA2HUK [3] https://vimeo.com/116886609 Cheers, Offray On 02/06/15 05:09, Peter Uhnák wrote:
HI Offray,
I gave it a quick bash and come up with the following code. It's just a prototype and could be greatly simplified.
- MCVersionInfo ancestors for whatever reason returned empty array down the line (so its cut off at the end), but I didn't investigate the problem - edge building and possibly ancestor retrieval could be simplified with builders; I think RTMondrian has methods for it but can't remember exactly (agilevisualization mentioned RTGraphBuilder but that has been removed to my knowledge)
~~~~~~~~~~~~~~~ mc := MCSmalltalkhubRepository allInstances detect: [ :m | m project = 'Roassal2' ].
root := mc versionInfoFromFileNamed: mc readableFileNames first.
family := Set new. retriever := nil. retriever := [ :child | family add: child. child ancestors do: [ :a | retriever value: a ] ]. retriever value: root. obs := family asGroup.
v := RTView new. es := RTEllipse new size: 15; color: Color blue; elementsOn: obs. v addAll: es.
edges := RTEdge buildEdgesFromObjects: obs from: #yourself toAll: #ancestors using: (RTArrowedLine new withShorterDistanceAttachPoint; color: Color red) scope: es. v addAll: edges.
es @ RTDraggable. es @ (RTLabelled new text: [ :m | m nameWithout: 'Roassal2' ]).
v @ RTDraggableView. v @ RTZoomableView.
RTDominanceTreeLayout new verticalGap: 30; horizontalGap: 15; on: es.
v open ~~~~~~~~~~~~~~~~
Cheers, Peter â
On Tue, Jun 2, 2015 at 5:39 AM, Offray Vladimir Luna Cárdenas <offray@riseup.net <mailto:offray@riseup.net>> wrote:
Hi,
On a closer detail, seems that [1] contains the starting point I'm looking for. I'll keep you posted and of course any other approach will be listened.
[1] https://dl.dropboxusercontent.com/u/31543901/AgileVisualization/Roassal/0104...
Cheers,
Offray
On 01/06/15 22:04, Offray Vladimir Luna Cárdenas wrote:
Hi all,
I had asked a similar question before with no much advances, but today I made a discovery that can improve the things a lot: how to export timeline data as structured JSON [1] (and of course this open the possibility to work with it on Pharo). Now I would like to graph the data as a tree with forks, merges and dates and authors of commits. I have seen chronia, but seems overkill for this feature (and is integrated with CVS only).
[1] http://stackoverflow.com/questions/30577090/how-to-export-fossil-scm-timelin...
As usual, any pointer on how to get this going will be greatly appreciated and I will give feedback to the community on how to do it.
Cheers,
Offray
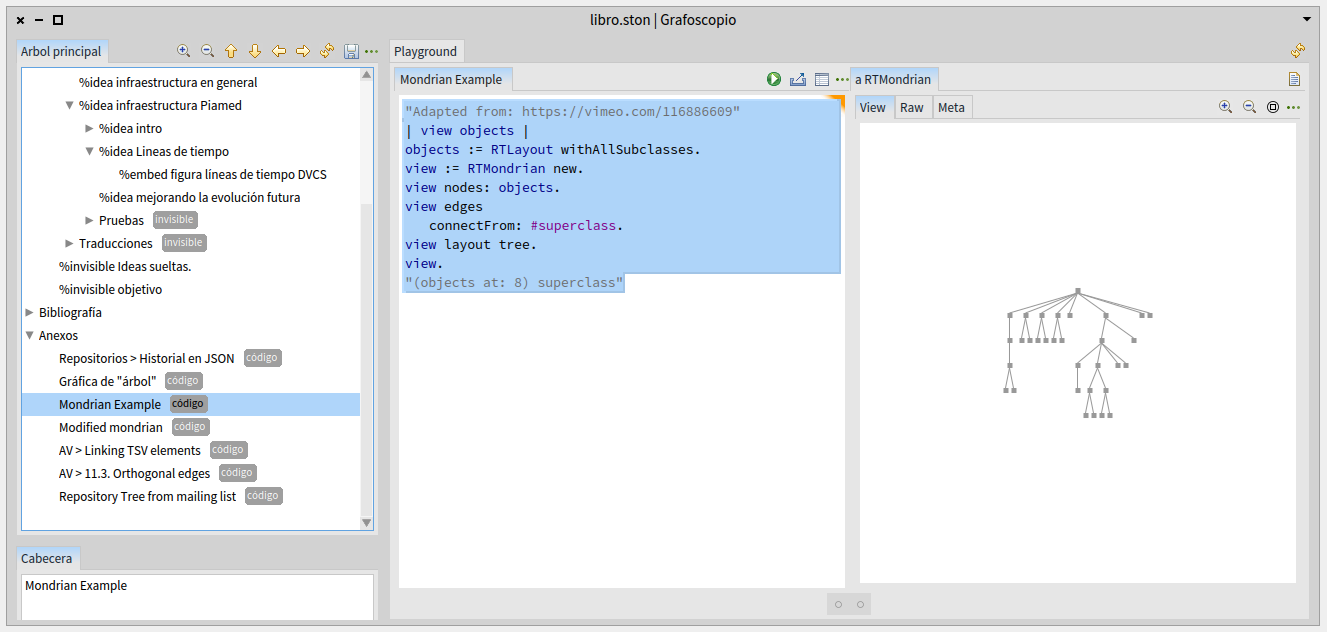
Hi all. Is me again :), I have being fighting all this morning trying to bet a better understanding of edge connections and tree layouts. I'm making some progress, but still I don't grasp it. At [1] you can find my starting example. So far, so good, so I created my own variation for my own data at [2]. My main issue is the #connectFrom message argument. If you uncomment the last line of [1] you will see that sending the #superclass message gives me an object that is of the same kind that the ones have been added to the view previously and I imagine that the reason they can be connected in a tree. With the example at [2] the message [#parents first] gives me a fossil commit object, but if I ran the code, the nodes are unconnected. What I'm missing? [1] http://ws.stfx.eu/DK3VNXBVAHXF [2] http://ws.stfx.eu/DHF4VIR8TSPC Thanks, Offray On 15/06/15 06:47, Offray Vladimir Luna Cárdenas wrote:
Hi Peter,
Thanks for your quick answer. I was pretty curious about trying to implement some of this ideas, but only until today I had the proper time to do it. I ran your code and now I'm trying to translate the ideas on it to my problem: Drawing a tree for the story of a fossil repository.
First, using the procedure at [1] I was able to export a fossil commit repo history as Json and by running the script at [2] I was able to get a small set of dots, which represent dictionaries with all commit data, including ancestors for each node, like the attached screenshot shows. In the video at [3] at 1:06 min, seems that lays the key for my visualization, but for that I need to create a fossil commit object that can understand the #ancestor message. Because I already have them as dictionaries thanks to NeoJson, seems that I'm really close to get the visualization I'm looking for. I hope to work on it this morning and return to the list with data visualizations or more questions.
[1] http://stackoverflow.com/questions/30577090/how-to-export-fossil-scm-timelin... [2] http://ws.stfx.eu/A5C8JJMA2HUK [3] https://vimeo.com/116886609
Cheers,
Offray
On 02/06/15 05:09, Peter Uhnák wrote:
HI Offray,
I gave it a quick bash and come up with the following code. It's just a prototype and could be greatly simplified.
- MCVersionInfo ancestors for whatever reason returned empty array down the line (so its cut off at the end), but I didn't investigate the problem - edge building and possibly ancestor retrieval could be simplified with builders; I think RTMondrian has methods for it but can't remember exactly (agilevisualization mentioned RTGraphBuilder but that has been removed to my knowledge)
~~~~~~~~~~~~~~~ mc := MCSmalltalkhubRepository allInstances detect: [ :m | m project = 'Roassal2' ].
root := mc versionInfoFromFileNamed: mc readableFileNames first.
family := Set new. retriever := nil. retriever := [ :child | family add: child. child ancestors do: [ :a | retriever value: a ] ]. retriever value: root. obs := family asGroup.
v := RTView new. es := RTEllipse new size: 15; color: Color blue; elementsOn: obs. v addAll: es.
edges := RTEdge buildEdgesFromObjects: obs from: #yourself toAll: #ancestors using: (RTArrowedLine new withShorterDistanceAttachPoint; color: Color red) scope: es. v addAll: edges.
es @ RTDraggable. es @ (RTLabelled new text: [ :m | m nameWithout: 'Roassal2' ]).
v @ RTDraggableView. v @ RTZoomableView.
RTDominanceTreeLayout new verticalGap: 30; horizontalGap: 15; on: es.
v open ~~~~~~~~~~~~~~~~
Cheers, Peter â
On Tue, Jun 2, 2015 at 5:39 AM, Offray Vladimir Luna Cárdenas <offray@riseup.net <mailto:offray@riseup.net>> wrote:
Hi,
On a closer detail, seems that [1] contains the starting point I'm looking for. I'll keep you posted and of course any other approach will be listened.
[1] https://dl.dropboxusercontent.com/u/31543901/AgileVisualization/Roassal/0104...
Cheers,
Offray
On 01/06/15 22:04, Offray Vladimir Luna Cárdenas wrote:
Hi all,
I had asked a similar question before with no much advances, but today I made a discovery that can improve the things a lot: how to export timeline data as structured JSON [1] (and of course this open the possibility to work with it on Pharo). Now I would like to graph the data as a tree with forks, merges and dates and authors of commits. I have seen chronia, but seems overkill for this feature (and is integrated with CVS only).
[1] http://stackoverflow.com/questions/30577090/how-to-export-fossil-scm-timelin...
As usual, any pointer on how to get this going will be greatly appreciated and I will give feedback to the community on how to do it.
Cheers,
Offray
I am not really following. Hard to guess here. Can you make the image accessible for me? I can then have a closer look at it. Alexandre
On Jun 15, 2015, at 3:18 PM, Offray Vladimir Luna Cárdenas <offray@riseup.net> wrote:
Hi all. Is me again :),
I have being fighting all this morning trying to bet a better understanding of edge connections and tree layouts. I'm making some progress, but still I don't grasp it. At [1] you can find my starting example. So far, so good, so I created my own variation for my own data at [2]. My main issue is the #connectFrom message argument. If you uncomment the last line of [1] you will see that sending the #superclass message gives me an object that is of the same kind that the ones have been added to the view previously and I imagine that the reason they can be connected in a tree. With the example at [2] the message [#parents first] gives me a fossil commit object, but if I ran the code, the nodes are unconnected. What I'm missing?
[1] http://ws.stfx.eu/DK3VNXBVAHXF [2] http://ws.stfx.eu/DHF4VIR8TSPC
Thanks,
Offray
On 15/06/15 06:47, Offray Vladimir Luna Cárdenas wrote:
Hi Peter,
Thanks for your quick answer. I was pretty curious about trying to implement some of this ideas, but only until today I had the proper time to do it. I ran your code and now I'm trying to translate the ideas on it to my problem: Drawing a tree for the story of a fossil repository.
First, using the procedure at [1] I was able to export a fossil commit repo history as Json and by running the script at [2] I was able to get a small set of dots, which represent dictionaries with all commit data, including ancestors for each node, like the attached screenshot shows. In the video at [3] at 1:06 min, seems that lays the key for my visualization, but for that I need to create a fossil commit object that can understand the #ancestor message. Because I already have them as dictionaries thanks to NeoJson, seems that I'm really close to get the visualization I'm looking for. I hope to work on it this morning and return to the list with data visualizations or more questions.
[1] http://stackoverflow.com/questions/30577090/how-to-export-fossil-scm-timelin... [2] http://ws.stfx.eu/A5C8JJMA2HUK [3] https://vimeo.com/116886609
Cheers,
Offray
On 02/06/15 05:09, Peter Uhnák wrote:
HI Offray,
I gave it a quick bash and come up with the following code. It's just a prototype and could be greatly simplified.
- MCVersionInfo ancestors for whatever reason returned empty array down the line (so its cut off at the end), but I didn't investigate the problem - edge building and possibly ancestor retrieval could be simplified with builders; I think RTMondrian has methods for it but can't remember exactly (agilevisualization mentioned RTGraphBuilder but that has been removed to my knowledge)
~~~~~~~~~~~~~~~ mc := MCSmalltalkhubRepository allInstances detect: [ :m | m project = 'Roassal2' ].
root := mc versionInfoFromFileNamed: mc readableFileNames first.
family := Set new. retriever := nil. retriever := [ :child | family add: child. child ancestors do: [ :a | retriever value: a ] ]. retriever value: root. obs := family asGroup.
v := RTView new. es := RTEllipse new size: 15; color: Color blue; elementsOn: obs. v addAll: es.
edges := RTEdge buildEdgesFromObjects: obs from: #yourself toAll: #ancestors using: (RTArrowedLine new withShorterDistanceAttachPoint; color: Color red) scope: es. v addAll: edges.
es @ RTDraggable. es @ (RTLabelled new text: [ :m | m nameWithout: 'Roassal2' ]).
v @ RTDraggableView. v @ RTZoomableView.
RTDominanceTreeLayout new verticalGap: 30; horizontalGap: 15; on: es.
v open ~~~~~~~~~~~~~~~~
<Mail Attachment.png>
Cheers, Peter â
On Tue, Jun 2, 2015 at 5:39 AM, Offray Vladimir Luna Cárdenas <offray@riseup.net> wrote: Hi,
On a closer detail, seems that [1] contains the starting point I'm looking for. I'll keep you posted and of course any other approach will be listened.
[1] https://dl.dropboxusercontent.com/u/31543901/AgileVisualization/Roassal/0104...
Cheers,
Offray
On 01/06/15 22:04, Offray Vladimir Luna Cárdenas wrote: Hi all,
I had asked a similar question before with no much advances, but today I made a discovery that can improve the things a lot: how to export timeline data as structured JSON [1] (and of course this open the possibility to work with it on Pharo). Now I would like to graph the data as a tree with forks, merges and dates and authors of commits. I have seen chronia, but seems overkill for this feature (and is integrated with CVS only).
[1] http://stackoverflow.com/questions/30577090/how-to-export-fossil-scm-timelin...
As usual, any pointer on how to get this going will be greatly appreciated and I will give feedback to the community on how to do it.
Cheers,
Offray
-- _,.;:~^~:;._,.;:~^~:;._,.;:~^~:;._,.;:~^~:;._,.;: Alexandre Bergel http://www.bergel.eu ^~:;._,.;:~^~:;._,.;:~^~:;._,.;:~^~:;._,.;:~^~:;.
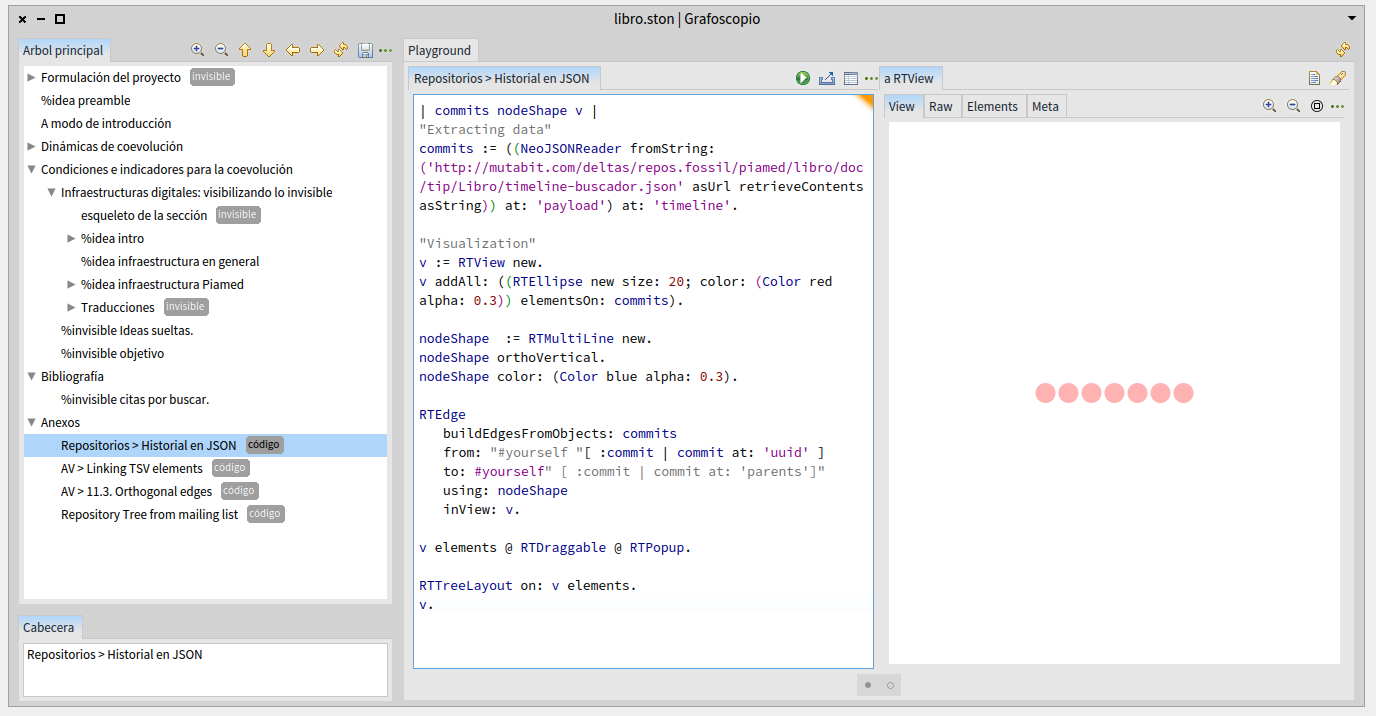
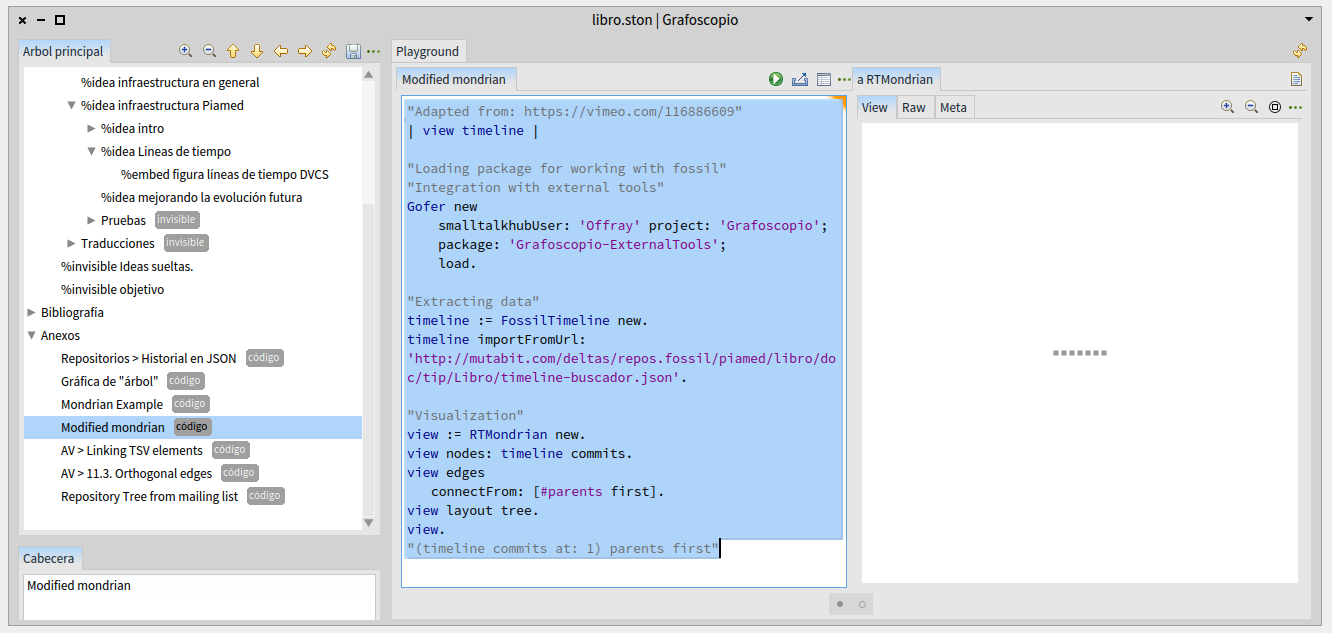
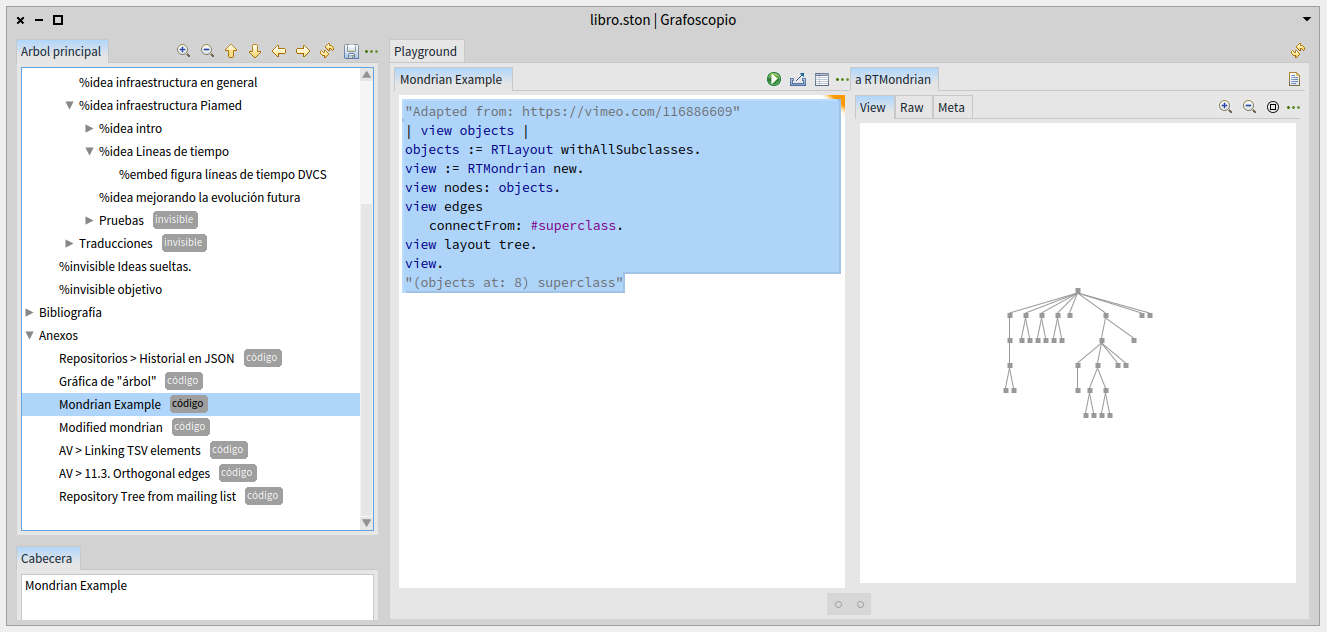
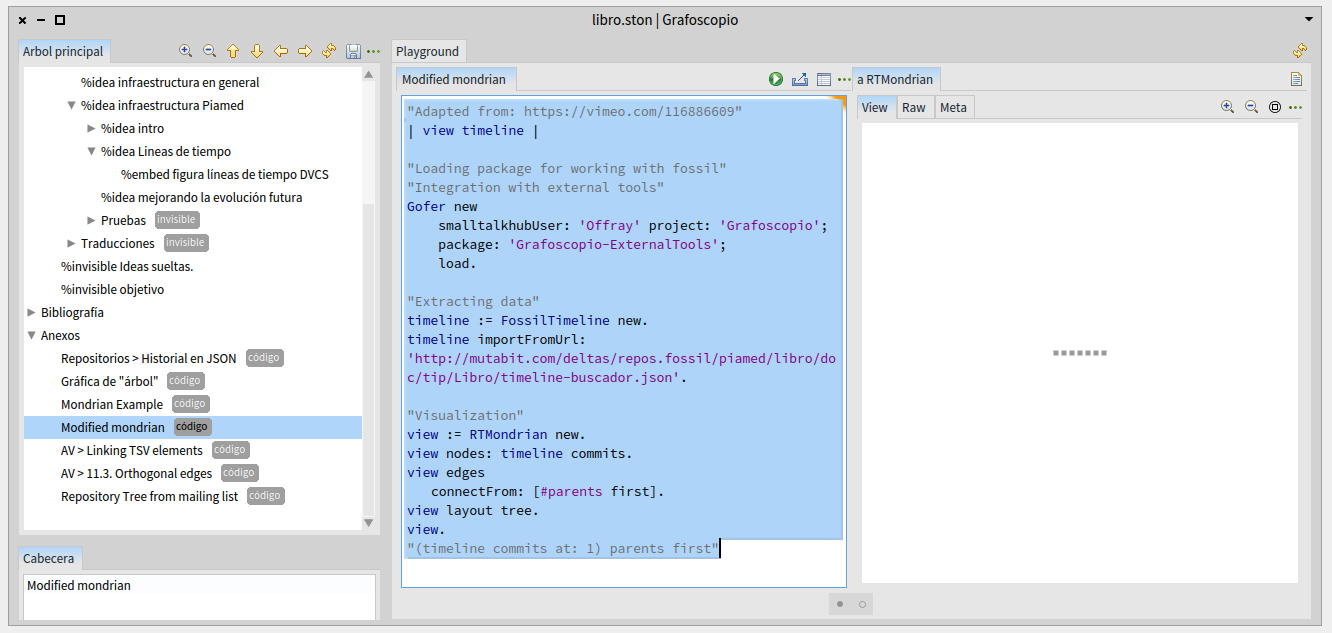
Alexandre, Could you please run this: ~~~~~~~~~ "Adapted from: https://vimeo.com/116886609" | view timeline | "Loading package for working with fossil" "Integration with external tools" Gofer new smalltalkhubUser: 'Offray' project: 'Grafoscopio'; package: 'Grafoscopio-ExternalTools'; load. "Extracting data" timeline := FossilTimeline new. timeline importFromUrl: 'http://mutabit.com/deltas/repos.fossil/piamed/libro/doc/tip/Libro/timeline-b...'. "Visualization" view := RTMondrian new. view nodes: timeline commits. view edges connectFrom: [#parents first]. view layout tree. view. "(timeline commits at: 1) parents first" ~~~~~~~~~ At the end you will get a set of squares visualized like this ones: ^Up Graphic 1: Trying to understand edges. These squares are representations of FossilCommits objects imported from a Json file, and the "connectFrom: [#parents first]" is the line I'm having problems with. "#parents first" is the message I send to each node to know its parents in that very collection of commits, so I imagined that if I put that as the block argument for "connectFrom" I would get a nice tree, similar to the graphic 2 below. I don't get what's happening here or what I'm missing. ^ Up Graphic 2: A nicely drawn mondrian tree layout for RTLayout. Any help on how to get tree like visualizations for this Fossil objects would be greatly appreciated. Thanks, Offray Ps: Something was happening with ws.stfx.eu this morning at 7:00 (GMT -5) and trying to publish a workspace gives a 500 error. On 16/06/15 16:08, Alexandre Bergel wrote:
I am not really following. Hard to guess here.
Can you make the image accessible for me? I can then have a closer look at it.
Alexandre
On Jun 15, 2015, at 3:18 PM, Offray Vladimir Luna Cárdenas <offray@riseup.net> wrote:
Hi all. Is me again :),
I have being fighting all this morning trying to bet a better understanding of edge connections and tree layouts. I'm making some progress, but still I don't grasp it. At [1] you can find my starting example. So far, so good, so I created my own variation for my own data at [2]. My main issue is the #connectFrom message argument. If you uncomment the last line of [1] you will see that sending the #superclass message gives me an object that is of the same kind that the ones have been added to the view previously and I imagine that the reason they can be connected in a tree. With the example at [2] the message [#parents first] gives me a fossil commit object, but if I ran the code, the nodes are unconnected. What I'm missing?
[1] http://ws.stfx.eu/DK3VNXBVAHXF [2] http://ws.stfx.eu/DHF4VIR8TSPC
Thanks,
Offray
On 15/06/15 06:47, Offray Vladimir Luna Cárdenas wrote:
Hi Peter,
Thanks for your quick answer. I was pretty curious about trying to implement some of this ideas, but only until today I had the proper time to do it. I ran your code and now I'm trying to translate the ideas on it to my problem: Drawing a tree for the story of a fossil repository.
First, using the procedure at [1] I was able to export a fossil commit repo history as Json and by running the script at [2] I was able to get a small set of dots, which represent dictionaries with all commit data, including ancestors for each node, like the attached screenshot shows. In the video at [3] at 1:06 min, seems that lays the key for my visualization, but for that I need to create a fossil commit object that can understand the #ancestor message. Because I already have them as dictionaries thanks to NeoJson, seems that I'm really close to get the visualization I'm looking for. I hope to work on it this morning and return to the list with data visualizations or more questions.
[1] http://stackoverflow.com/questions/30577090/how-to-export-fossil-scm-timelin... [2] http://ws.stfx.eu/A5C8JJMA2HUK [3] https://vimeo.com/116886609
Cheers,
Offray
On 02/06/15 05:09, Peter Uhnák wrote:
HI Offray,
I gave it a quick bash and come up with the following code. It's just a prototype and could be greatly simplified.
- MCVersionInfo ancestors for whatever reason returned empty array down the line (so its cut off at the end), but I didn't investigate the problem - edge building and possibly ancestor retrieval could be simplified with builders; I think RTMondrian has methods for it but can't remember exactly (agilevisualization mentioned RTGraphBuilder but that has been removed to my knowledge)
~~~~~~~~~~~~~~~ mc := MCSmalltalkhubRepository allInstances detect: [ :m | m project = 'Roassal2' ].
root := mc versionInfoFromFileNamed: mc readableFileNames first.
family := Set new. retriever := nil. retriever := [ :child | family add: child. child ancestors do: [ :a | retriever value: a ] ]. retriever value: root. obs := family asGroup.
v := RTView new. es := RTEllipse new size: 15; color: Color blue; elementsOn: obs. v addAll: es.
edges := RTEdge buildEdgesFromObjects: obs from: #yourself toAll: #ancestors using: (RTArrowedLine new withShorterDistanceAttachPoint; color: Color red) scope: es. v addAll: edges.
es @ RTDraggable. es @ (RTLabelled new text: [ :m | m nameWithout: 'Roassal2' ]).
v @ RTDraggableView. v @ RTZoomableView.
RTDominanceTreeLayout new verticalGap: 30; horizontalGap: 15; on: es.
v open ~~~~~~~~~~~~~~~~
<Mail Attachment.png>
Cheers, Peter â
On Tue, Jun 2, 2015 at 5:39 AM, Offray Vladimir Luna Cárdenas <offray@riseup.net> wrote: Hi,
On a closer detail, seems that [1] contains the starting point I'm looking for. I'll keep you posted and of course any other approach will be listened.
[1] https://dl.dropboxusercontent.com/u/31543901/AgileVisualization/Roassal/0104...
Cheers,
Offray
On 01/06/15 22:04, Offray Vladimir Luna Cárdenas wrote: Hi all,
I had asked a similar question before with no much advances, but today I made a discovery that can improve the things a lot: how to export timeline data as structured JSON [1] (and of course this open the possibility to work with it on Pharo). Now I would like to graph the data as a tree with forks, merges and dates and authors of commits. I have seen chronia, but seems overkill for this feature (and is integrated with CVS only).
[1] http://stackoverflow.com/questions/30577090/how-to-export-fossil-scm-timelin...
As usual, any pointer on how to get this going will be greatly appreciated and I will give feedback to the community on how to do it.
Cheers,
Offray

2015-06-19 14:41 GMT+02:00 Offray Vladimir Luna Cárdenas <offray@riseup.net> :
Alexandre,
Could you please run this:
~~~~~~~~~ "Adapted from: https://vimeo.com/116886609" | view timeline |
"Loading package for working with fossil" "Integration with external tools" Gofer new smalltalkhubUser: 'Offray' project: 'Grafoscopio'; package: 'Grafoscopio-ExternalTools'; load.
"Extracting data" timeline := FossilTimeline new. timeline importFromUrl: ' http://mutabit.com/deltas/repos.fossil/piamed/libro/doc/tip/Libro/timeline-b... '.
"Visualization" view := RTMondrian new. view nodes: timeline commits. view edges connectFrom: [#parents first]. view layout tree. view. "(timeline commits at: 1) parents first" ~~~~~~~~~
At the end you will get a set of squares visualized like this ones:
^Up Graphic 1: Trying to understand edges.
These squares are representations of FossilCommits objects imported from a Json file, and the "connectFrom: [#parents first]" is the line I'm having problems with. "#parents first" is the message I send to each node to know its parents in that very collection of commits, so I imagined that if I put that as the block argument for "connectFrom" I would get a nice tree, similar to the graphic 2 below. I don't get what's happening here or what I'm missing.
1. check if the parents can be nil 2. I don't know why, but with connectFrom:, all nodes layout at the same position -> connectTo: works view edges connectTo: [:e | e parents ifNil:[e] ifNotNil:[:p | p first]].
^ Up Graphic 2: A nicely drawn mondrian tree layout for RTLayout.
Any help on how to get tree like visualizations for this Fossil objects would be greatly appreciated.
Thanks,
Offray
Ps: Something was happening with ws.stfx.eu this morning at 7:00 (GMT -5) and trying to publish a workspace gives a 500 error.
On 16/06/15 16:08, Alexandre Bergel wrote:
I am not really following. Hard to guess here.
Can you make the image accessible for me? I can then have a closer look at it.
Alexandre
On Jun 15, 2015, at 3:18 PM, Offray Vladimir Luna Cárdenas <offray@riseup.net> <offray@riseup.net> wrote:
Hi all. Is me again :),
I have being fighting all this morning trying to bet a better understanding of edge connections and tree layouts. I'm making some progress, but still I don't grasp it. At [1] you can find my starting example. So far, so good, so I created my own variation for my own data at [2]. My main issue is the #connectFrom message argument. If you uncomment the last line of [1] you will see that sending the #superclass message gives me an object that is of the same kind that the ones have been added to the view previously and I imagine that the reason they can be connected in a tree. With the example at [2] the message [#parents first] gives me a fossil commit object, but if I ran the code, the nodes are unconnected. What I'm missing?
[1] http://ws.stfx.eu/DK3VNXBVAHXF [2] http://ws.stfx.eu/DHF4VIR8TSPC
Thanks,
Offray
On 15/06/15 06:47, Offray Vladimir Luna Cárdenas wrote:
Hi Peter,
Thanks for your quick answer. I was pretty curious about trying to implement some of this ideas, but only until today I had the proper time to do it. I ran your code and now I'm trying to translate the ideas on it to my problem: Drawing a tree for the story of a fossil repository.
First, using the procedure at [1] I was able to export a fossil commit repo history as Json and by running the script at [2] I was able to get a small set of dots, which represent dictionaries with all commit data, including ancestors for each node, like the attached screenshot shows. In the video at [3] at 1:06 min, seems that lays the key for my visualization, but for that I need to create a fossil commit object that can understand the #ancestor message. Because I already have them as dictionaries thanks to NeoJson, seems that I'm really close to get the visualization I'm looking for. I hope to work on it this morning and return to the list with data visualizations or more questions.
[1] http://stackoverflow.com/questions/30577090/how-to-export-fossil-scm-timelin... [2] http://ws.stfx.eu/A5C8JJMA2HUK [3] https://vimeo.com/116886609
Cheers,
Offray
On 02/06/15 05:09, Peter Uhnák wrote:
HI Offray,
I gave it a quick bash and come up with the following code. It's just a prototype and could be greatly simplified.
- MCVersionInfo ancestors for whatever reason returned empty array down the line (so its cut off at the end), but I didn't investigate the problem - edge building and possibly ancestor retrieval could be simplified with builders; I think RTMondrian has methods for it but can't remember exactly (agilevisualization mentioned RTGraphBuilder but that has been removed to my knowledge)
~~~~~~~~~~~~~~~ mc := MCSmalltalkhubRepository allInstances detect: [ :m | m project = 'Roassal2' ].
root := mc versionInfoFromFileNamed: mc readableFileNames first.
family := Set new. retriever := nil. retriever := [ :child | family add: child. child ancestors do: [ :a | retriever value: a ] ]. retriever value: root. obs := family asGroup.
v := RTView new. es := RTEllipse new size: 15; color: Color blue; elementsOn: obs. v addAll: es.
edges := RTEdge buildEdgesFromObjects: obs from: #yourself toAll: #ancestors using: (RTArrowedLine new withShorterDistanceAttachPoint; color: Color red) scope: es. v addAll: edges.
es @ RTDraggable. es @ (RTLabelled new text: [ :m | m nameWithout: 'Roassal2' ]).
v @ RTDraggableView. v @ RTZoomableView.
RTDominanceTreeLayout new verticalGap: 30; horizontalGap: 15; on: es.
v open ~~~~~~~~~~~~~~~~
<Mail Attachment.png>
Cheers, Peter â
On Tue, Jun 2, 2015 at 5:39 AM, Offray Vladimir Luna Cárdenas <offray@riseup.net> <offray@riseup.net> wrote: Hi,
On a closer detail, seems that [1] contains the starting point I'm looking for. I'll keep you posted and of course any other approach will be listened.
[1] https://dl.dropboxusercontent.com/u/31543901/AgileVisualization/Roassal/0104...
Cheers,
Offray
On 01/06/15 22:04, Offray Vladimir Luna Cárdenas wrote: Hi all,
I had asked a similar question before with no much advances, but today I made a discovery that can improve the things a lot: how to export timeline data as structured JSON [1] (and of course this open the possibility to work with it on Pharo). Now I would like to graph the data as a tree with forks, merges and dates and authors of commits. I have seen chronia, but seems overkill for this feature (and is integrated with CVS only).
[1] http://stackoverflow.com/questions/30577090/how-to-export-fossil-scm-timelin...
As usual, any pointer on how to get this going will be greatly appreciated and I will give feedback to the community on how to do it.
Cheers,
Offray

On 19 Jun 2015, at 14:41, Offray Vladimir Luna Cárdenas <offray@riseup.net> wrote:
Ps: Something was happening with ws.stfx.eu this morning at 7:00 (GMT -5) and trying to publish a workspace gives a 500 error.
Yes, there was a problem due to a recent upgrade to Pharo 4. It should be fixed now. Sven
Hi Offray, The problem is rather easy to solve. Consider this script: -=-=-=-=-=-=-=-=-=-=-=-= timeline := FossilTimeline new. timeline importFromUrl: 'http://mutabit.com/deltas/repos.fossil/piamed/libro/doc/tip/Libro/timeline-b...'. "Visualization" view := RTMondrian new. view nodes: timeline commits. view edges connectFrom: #parents. view layout tree. view. -=-=-=-=-=-=-=-=-=-=-=-= Apparently, each fossil commit has a parent. The parent could be nil (which is okay). Why do you call the variable âparentsâ and not âparentâ ? Cheers, Alexandre
On Jun 19, 2015, at 9:41 AM, Offray Vladimir Luna Cárdenas <offray@riseup.net> wrote:
Alexandre,
Could you please run this:
~~~~~~~~~ "Adapted from: https://vimeo.com/116886609" | view timeline |
"Loading package for working with fossil" "Integration with external tools" Gofer new smalltalkhubUser: 'Offray' project: 'Grafoscopio'; package: 'Grafoscopio-ExternalTools'; load.
"Extracting data" timeline := FossilTimeline new. timeline importFromUrl: 'http://mutabit.com/deltas/repos.fossil/piamed/libro/doc/tip/Libro/timeline-b...'.
"Visualization" view := RTMondrian new. view nodes: timeline commits. view edges connectFrom: [#parents first]. view layout tree. view. "(timeline commits at: 1) parents first" ~~~~~~~~~
At the end you will get a set of squares visualized like this ones:
<jcjdcjje..png> ^Up Graphic 1: Trying to understand edges.
These squares are representations of FossilCommits objects imported from a Json file, and the "connectFrom: [#parents first]" is the line I'm having problems with. "#parents first" is the message I send to each node to know its parents in that very collection of commits, so I imagined that if I put that as the block argument for "connectFrom" I would get a nice tree, similar to the graphic 2 below. I don't get what's happening here or what I'm missing.
<cfbfiagc..png> ^ Up Graphic 2: A nicely drawn mondrian tree layout for RTLayout.
Any help on how to get tree like visualizations for this Fossil objects would be greatly appreciated.
Thanks,
Offray
Ps: Something was happening with ws.stfx.eu this morning at 7:00 (GMT -5) and trying to publish a workspace gives a 500 error.
On 16/06/15 16:08, Alexandre Bergel wrote:
I am not really following. Hard to guess here.
Can you make the image accessible for me? I can then have a closer look at it.
Alexandre
On Jun 15, 2015, at 3:18 PM, Offray Vladimir Luna Cárdenas <offray@riseup.net> wrote:
Hi all. Is me again :),
I have being fighting all this morning trying to bet a better understanding of edge connections and tree layouts. I'm making some progress, but still I don't grasp it. At [1] you can find my starting example. So far, so good, so I created my own variation for my own data at [2]. My main issue is the #connectFrom message argument. If you uncomment the last line of [1] you will see that sending the #superclass message gives me an object that is of the same kind that the ones have been added to the view previously and I imagine that the reason they can be connected in a tree. With the example at [2] the message [#parents first] gives me a fossil commit object, but if I ran the code, the nodes are unconnected. What I'm missing?
[1] http://ws.stfx.eu/DK3VNXBVAHXF
[2] http://ws.stfx.eu/DHF4VIR8TSPC
Thanks,
Offray
On 15/06/15 06:47, Offray Vladimir Luna Cárdenas wrote:
Hi Peter,
Thanks for your quick answer. I was pretty curious about trying to implement some of this ideas, but only until today I had the proper time to do it. I ran your code and now I'm trying to translate the ideas on it to my problem: Drawing a tree for the story of a fossil repository.
First, using the procedure at [1] I was able to export a fossil commit repo history as Json and by running the script at [2] I was able to get a small set of dots, which represent dictionaries with all commit data, including ancestors for each node, like the attached screenshot shows. In the video at [3] at 1:06 min, seems that lays the key for my visualization, but for that I need to create a fossil commit object that can understand the #ancestor message. Because I already have them as dictionaries thanks to NeoJson, seems that I'm really close to get the visualization I'm looking for. I hope to work on it this morning and return to the list with data visualizations or more questions.
[1] http://stackoverflow.com/questions/30577090/how-to-export-fossil-scm-timelin...
[2] http://ws.stfx.eu/A5C8JJMA2HUK
[3] https://vimeo.com/116886609
Cheers,
Offray
On 02/06/15 05:09, Peter Uhnák wrote:
HI Offray,
I gave it a quick bash and come up with the following code. It's just a prototype and could be greatly simplified.
- MCVersionInfo ancestors for whatever reason returned empty array down the line (so its cut off at the end), but I didn't investigate the problem - edge building and possibly ancestor retrieval could be simplified with builders; I think RTMondrian has methods for it but can't remember exactly (agilevisualization mentioned RTGraphBuilder but that has been removed to my knowledge)
~~~~~~~~~~~~~~~ mc := MCSmalltalkhubRepository allInstances detect: [ :m | m project = 'Roassal2' ].
root := mc versionInfoFromFileNamed: mc readableFileNames first.
family := Set new. retriever := nil. retriever := [ :child | family add: child. child ancestors do: [ :a | retriever value: a ] ]. retriever value: root. obs := family asGroup.
v := RTView new. es := RTEllipse new size: 15; color: Color blue; elementsOn: obs. v addAll: es.
edges := RTEdge buildEdgesFromObjects: obs from: #yourself toAll: #ancestors using: (RTArrowedLine new withShorterDistanceAttachPoint; color: Color red) scope: es. v addAll: edges.
es @ RTDraggable. es @ (RTLabelled new text: [ :m | m nameWithout: 'Roassal2' ]).
v @ RTDraggableView. v @ RTZoomableView.
RTDominanceTreeLayout new verticalGap: 30; horizontalGap: 15; on: es.
v open ~~~~~~~~~~~~~~~~
<Mail Attachment.png>
Cheers, Peter â
On Tue, Jun 2, 2015 at 5:39 AM, Offray Vladimir Luna Cárdenas <offray@riseup.net> wrote: Hi,
On a closer detail, seems that [1] contains the starting point I'm looking for. I'll keep you posted and of course any other approach will be listened.
[1] https://dl.dropboxusercontent.com/u/31543901/AgileVisualization/Roassal/0104...
Cheers,
Offray
On 01/06/15 22:04, Offray Vladimir Luna Cárdenas wrote: Hi all,
I had asked a similar question before with no much advances, but today I made a discovery that can improve the things a lot: how to export timeline data as structured JSON [1] (and of course this open the possibility to work with it on Pharo). Now I would like to graph the data as a tree with forks, merges and dates and authors of commits. I have seen chronia, but seems overkill for this feature (and is integrated with CVS only).
[1] http://stackoverflow.com/questions/30577090/how-to-export-fossil-scm-timelin...
As usual, any pointer on how to get this going will be greatly appreciated and I will give feedback to the community on how to do it.
Cheers,
Offray
-- _,.;:~^~:;._,.;:~^~:;._,.;:~^~:;._,.;:~^~:;._,.;: Alexandre Bergel http://www.bergel.eu ^~:;._,.;:~^~:;._,.;:~^~:;._,.;:~^~:;._,.;:~^~:;.
Let me know if this works for you Cheers, Alexandre
On Jun 20, 2015, at 2:46 PM, Alexandre Bergel <alexandre.bergel@me.com> wrote:
Hi Offray,
The problem is rather easy to solve. Consider this script:
-=-=-=-=-=-=-=-=-=-=-=-= timeline := FossilTimeline new. timeline importFromUrl: 'http://mutabit.com/deltas/repos.fossil/piamed/libro/doc/tip/Libro/timeline-b...'.
"Visualization" view := RTMondrian new. view nodes: timeline commits. view edges connectFrom: #parents. view layout tree. view. -=-=-=-=-=-=-=-=-=-=-=-=
Apparently, each fossil commit has a parent. The parent could be nil (which is okay). Why do you call the variable âparentsâ and not âparentâ ?
Cheers, Alexandre
On Jun 19, 2015, at 9:41 AM, Offray Vladimir Luna Cárdenas <offray@riseup.net> wrote:
Alexandre,
Could you please run this:
~~~~~~~~~ "Adapted from: https://vimeo.com/116886609" | view timeline |
"Loading package for working with fossil" "Integration with external tools" Gofer new smalltalkhubUser: 'Offray' project: 'Grafoscopio'; package: 'Grafoscopio-ExternalTools'; load.
"Extracting data" timeline := FossilTimeline new. timeline importFromUrl: 'http://mutabit.com/deltas/repos.fossil/piamed/libro/doc/tip/Libro/timeline-b...'.
"Visualization" view := RTMondrian new. view nodes: timeline commits. view edges connectFrom: [#parents first]. view layout tree. view. "(timeline commits at: 1) parents first" ~~~~~~~~~
At the end you will get a set of squares visualized like this ones:
<jcjdcjje..png> ^Up Graphic 1: Trying to understand edges.
These squares are representations of FossilCommits objects imported from a Json file, and the "connectFrom: [#parents first]" is the line I'm having problems with. "#parents first" is the message I send to each node to know its parents in that very collection of commits, so I imagined that if I put that as the block argument for "connectFrom" I would get a nice tree, similar to the graphic 2 below. I don't get what's happening here or what I'm missing.
<cfbfiagc..png> ^ Up Graphic 2: A nicely drawn mondrian tree layout for RTLayout.
Any help on how to get tree like visualizations for this Fossil objects would be greatly appreciated.
Thanks,
Offray
Ps: Something was happening with ws.stfx.eu this morning at 7:00 (GMT -5) and trying to publish a workspace gives a 500 error.
On 16/06/15 16:08, Alexandre Bergel wrote:
I am not really following. Hard to guess here.
Can you make the image accessible for me? I can then have a closer look at it.
Alexandre
On Jun 15, 2015, at 3:18 PM, Offray Vladimir Luna Cárdenas <offray@riseup.net> wrote:
Hi all. Is me again :),
I have being fighting all this morning trying to bet a better understanding of edge connections and tree layouts. I'm making some progress, but still I don't grasp it. At [1] you can find my starting example. So far, so good, so I created my own variation for my own data at [2]. My main issue is the #connectFrom message argument. If you uncomment the last line of [1] you will see that sending the #superclass message gives me an object that is of the same kind that the ones have been added to the view previously and I imagine that the reason they can be connected in a tree. With the example at [2] the message [#parents first] gives me a fossil commit object, but if I ran the code, the nodes are unconnected. What I'm missing?
[1] http://ws.stfx.eu/DK3VNXBVAHXF
[2] http://ws.stfx.eu/DHF4VIR8TSPC
Thanks,
Offray
On 15/06/15 06:47, Offray Vladimir Luna Cárdenas wrote:
Hi Peter,
Thanks for your quick answer. I was pretty curious about trying to implement some of this ideas, but only until today I had the proper time to do it. I ran your code and now I'm trying to translate the ideas on it to my problem: Drawing a tree for the story of a fossil repository.
First, using the procedure at [1] I was able to export a fossil commit repo history as Json and by running the script at [2] I was able to get a small set of dots, which represent dictionaries with all commit data, including ancestors for each node, like the attached screenshot shows. In the video at [3] at 1:06 min, seems that lays the key for my visualization, but for that I need to create a fossil commit object that can understand the #ancestor message. Because I already have them as dictionaries thanks to NeoJson, seems that I'm really close to get the visualization I'm looking for. I hope to work on it this morning and return to the list with data visualizations or more questions.
[1] http://stackoverflow.com/questions/30577090/how-to-export-fossil-scm-timelin...
[2] http://ws.stfx.eu/A5C8JJMA2HUK
[3] https://vimeo.com/116886609
Cheers,
Offray
On 02/06/15 05:09, Peter Uhnák wrote:
HI Offray,
I gave it a quick bash and come up with the following code. It's just a prototype and could be greatly simplified.
- MCVersionInfo ancestors for whatever reason returned empty array down the line (so its cut off at the end), but I didn't investigate the problem - edge building and possibly ancestor retrieval could be simplified with builders; I think RTMondrian has methods for it but can't remember exactly (agilevisualization mentioned RTGraphBuilder but that has been removed to my knowledge)
~~~~~~~~~~~~~~~ mc := MCSmalltalkhubRepository allInstances detect: [ :m | m project = 'Roassal2' ].
root := mc versionInfoFromFileNamed: mc readableFileNames first.
family := Set new. retriever := nil. retriever := [ :child | family add: child. child ancestors do: [ :a | retriever value: a ] ]. retriever value: root. obs := family asGroup.
v := RTView new. es := RTEllipse new size: 15; color: Color blue; elementsOn: obs. v addAll: es.
edges := RTEdge buildEdgesFromObjects: obs from: #yourself toAll: #ancestors using: (RTArrowedLine new withShorterDistanceAttachPoint; color: Color red) scope: es. v addAll: edges.
es @ RTDraggable. es @ (RTLabelled new text: [ :m | m nameWithout: 'Roassal2' ]).
v @ RTDraggableView. v @ RTZoomableView.
RTDominanceTreeLayout new verticalGap: 30; horizontalGap: 15; on: es.
v open ~~~~~~~~~~~~~~~~
<Mail Attachment.png>
Cheers, Peter â
On Tue, Jun 2, 2015 at 5:39 AM, Offray Vladimir Luna Cárdenas <offray@riseup.net> wrote: Hi,
On a closer detail, seems that [1] contains the starting point I'm looking for. I'll keep you posted and of course any other approach will be listened.
[1] https://dl.dropboxusercontent.com/u/31543901/AgileVisualization/Roassal/0104...
Cheers,
Offray
On 01/06/15 22:04, Offray Vladimir Luna Cárdenas wrote: Hi all,
I had asked a similar question before with no much advances, but today I made a discovery that can improve the things a lot: how to export timeline data as structured JSON [1] (and of course this open the possibility to work with it on Pharo). Now I would like to graph the data as a tree with forks, merges and dates and authors of commits. I have seen chronia, but seems overkill for this feature (and is integrated with CVS only).
[1] http://stackoverflow.com/questions/30577090/how-to-export-fossil-scm-timelin...
As usual, any pointer on how to get this going will be greatly appreciated and I will give feedback to the community on how to do it.
Cheers,
Offray
-- _,.;:~^~:;._,.;:~^~:;._,.;:~^~:;._,.;:~^~:;._,.;: Alexandre Bergel http://www.bergel.eu ^~:;._,.;:~^~:;._,.;:~^~:;._,.;:~^~:;._,.;:~^~:;.
-- _,.;:~^~:;._,.;:~^~:;._,.;:~^~:;._,.;:~^~:;._,.;: Alexandre Bergel http://www.bergel.eu ^~:;._,.;:~^~:;._,.;:~^~:;._,.;:~^~:;._,.;:~^~:;.
Thanks Alexandre and Nicolai, Now with a modified version of the script at http://ws.stfx.eu/AOPPDKEGTVFG I get the result below at the left, which has practically the same topology of the original fossil timeline tree below at right. Now I would like to change the edge length so it can convey commit date information (when commit happens) and look even more similar. I will make some test with RTMultiLine and orthoVertical shapes for edges, but any pointer to edge length variation and node distance examples will be greatly appreciated. Finally about why "parents" instead of "parent" I try to use the same terms in the Json file export for the properties imported in the object. I imagine that if a commit is a merge of several branches, it could have several parents. I will test with more complicated trees to test if this case prompts. Cheers, Offray On 20/06/15 12:46, Alexandre Bergel wrote:
Hi Offray,
The problem is rather easy to solve. Consider this script:
-=-=-=-=-=-=-=-=-=-=-=-= timeline := FossilTimeline new. timeline importFromUrl: 'http://mutabit.com/deltas/repos.fossil/piamed/libro/doc/tip/Libro/timeline-b...'.
"Visualization" view := RTMondrian new. view nodes: timeline commits. view edges connectFrom: #parents. view layout tree. view. -=-=-=-=-=-=-=-=-=-=-=-=
Apparently, each fossil commit has a parent. The parent could be nil (which is okay). Why do you call the variable âparentsâ and not âparentâ ?
Cheers, Alexandre
On Jun 19, 2015, at 9:41 AM, Offray Vladimir Luna Cárdenas <offray@riseup.net> wrote:
Alexandre,
Could you please run this:
~~~~~~~~~ "Adapted from: https://vimeo.com/116886609" | view timeline |
"Loading package for working with fossil" "Integration with external tools" Gofer new smalltalkhubUser: 'Offray' project: 'Grafoscopio'; package: 'Grafoscopio-ExternalTools'; load.
"Extracting data" timeline := FossilTimeline new. timeline importFromUrl: 'http://mutabit.com/deltas/repos.fossil/piamed/libro/doc/tip/Libro/timeline-b...'.
"Visualization" view := RTMondrian new. view nodes: timeline commits. view edges connectFrom: [#parents first]. view layout tree. view. "(timeline commits at: 1) parents first" ~~~~~~~~~
At the end you will get a set of squares visualized like this ones:
<jcjdcjje..png> ^Up Graphic 1: Trying to understand edges.
These squares are representations of FossilCommits objects imported from a Json file, and the "connectFrom: [#parents first]" is the line I'm having problems with. "#parents first" is the message I send to each node to know its parents in that very collection of commits, so I imagined that if I put that as the block argument for "connectFrom" I would get a nice tree, similar to the graphic 2 below. I don't get what's happening here or what I'm missing.
<cfbfiagc..png> ^ Up Graphic 2: A nicely drawn mondrian tree layout for RTLayout.
Any help on how to get tree like visualizations for this Fossil objects would be greatly appreciated.
Thanks,
Offray
Ps: Something was happening with ws.stfx.eu this morning at 7:00 (GMT -5) and trying to publish a workspace gives a 500 error.
On 16/06/15 16:08, Alexandre Bergel wrote:
I am not really following. Hard to guess here.
Can you make the image accessible for me? I can then have a closer look at it.
Alexandre
On Jun 15, 2015, at 3:18 PM, Offray Vladimir Luna Cárdenas <offray@riseup.net> wrote:
Hi all. Is me again :),
I have being fighting all this morning trying to bet a better understanding of edge connections and tree layouts. I'm making some progress, but still I don't grasp it. At [1] you can find my starting example. So far, so good, so I created my own variation for my own data at [2]. My main issue is the #connectFrom message argument. If you uncomment the last line of [1] you will see that sending the #superclass message gives me an object that is of the same kind that the ones have been added to the view previously and I imagine that the reason they can be connected in a tree. With the example at [2] the message [#parents first] gives me a fossil commit object, but if I ran the code, the nodes are unconnected. What I'm missing?
[1] http://ws.stfx.eu/DK3VNXBVAHXF
[2] http://ws.stfx.eu/DHF4VIR8TSPC
Thanks,
Offray
On 15/06/15 06:47, Offray Vladimir Luna Cárdenas wrote:
Hi Peter,
Thanks for your quick answer. I was pretty curious about trying to implement some of this ideas, but only until today I had the proper time to do it. I ran your code and now I'm trying to translate the ideas on it to my problem: Drawing a tree for the story of a fossil repository.
First, using the procedure at [1] I was able to export a fossil commit repo history as Json and by running the script at [2] I was able to get a small set of dots, which represent dictionaries with all commit data, including ancestors for each node, like the attached screenshot shows. In the video at [3] at 1:06 min, seems that lays the key for my visualization, but for that I need to create a fossil commit object that can understand the #ancestor message. Because I already have them as dictionaries thanks to NeoJson, seems that I'm really close to get the visualization I'm looking for. I hope to work on it this morning and return to the list with data visualizations or more questions.
[1] http://stackoverflow.com/questions/30577090/how-to-export-fossil-scm-timelin...
[2] http://ws.stfx.eu/A5C8JJMA2HUK
[3] https://vimeo.com/116886609
Cheers,
Offray
On 02/06/15 05:09, Peter Uhnák wrote:
HI Offray,
I gave it a quick bash and come up with the following code. It's just a prototype and could be greatly simplified.
- MCVersionInfo ancestors for whatever reason returned empty array down the line (so its cut off at the end), but I didn't investigate the problem - edge building and possibly ancestor retrieval could be simplified with builders; I think RTMondrian has methods for it but can't remember exactly (agilevisualization mentioned RTGraphBuilder but that has been removed to my knowledge)
~~~~~~~~~~~~~~~ mc := MCSmalltalkhubRepository allInstances detect: [ :m | m project = 'Roassal2' ].
root := mc versionInfoFromFileNamed: mc readableFileNames first.
family := Set new. retriever := nil. retriever := [ :child | family add: child. child ancestors do: [ :a | retriever value: a ] ]. retriever value: root. obs := family asGroup.
v := RTView new. es := RTEllipse new size: 15; color: Color blue; elementsOn: obs. v addAll: es.
edges := RTEdge buildEdgesFromObjects: obs from: #yourself toAll: #ancestors using: (RTArrowedLine new withShorterDistanceAttachPoint; color: Color red) scope: es. v addAll: edges.
es @ RTDraggable. es @ (RTLabelled new text: [ :m | m nameWithout: 'Roassal2' ]).
v @ RTDraggableView. v @ RTZoomableView.
RTDominanceTreeLayout new verticalGap: 30; horizontalGap: 15; on: es.
v open ~~~~~~~~~~~~~~~~
<Mail Attachment.png>
Cheers, Peter â
On Tue, Jun 2, 2015 at 5:39 AM, Offray Vladimir Luna Cárdenas <offray@riseup.net> wrote: Hi,
On a closer detail, seems that [1] contains the starting point I'm looking for. I'll keep you posted and of course any other approach will be listened.
[1] https://dl.dropboxusercontent.com/u/31543901/AgileVisualization/Roassal/0104...
Cheers,
Offray
On 01/06/15 22:04, Offray Vladimir Luna Cárdenas wrote: Hi all,
I had asked a similar question before with no much advances, but today I made a discovery that can improve the things a lot: how to export timeline data as structured JSON [1] (and of course this open the possibility to work with it on Pharo). Now I would like to graph the data as a tree with forks, merges and dates and authors of commits. I have seen chronia, but seems overkill for this feature (and is integrated with CVS only).
[1] http://stackoverflow.com/questions/30577090/how-to-export-fossil-scm-timelin...
As usual, any pointer on how to get this going will be greatly appreciated and I will give feedback to the community on how to do it.
Cheers,
Offray
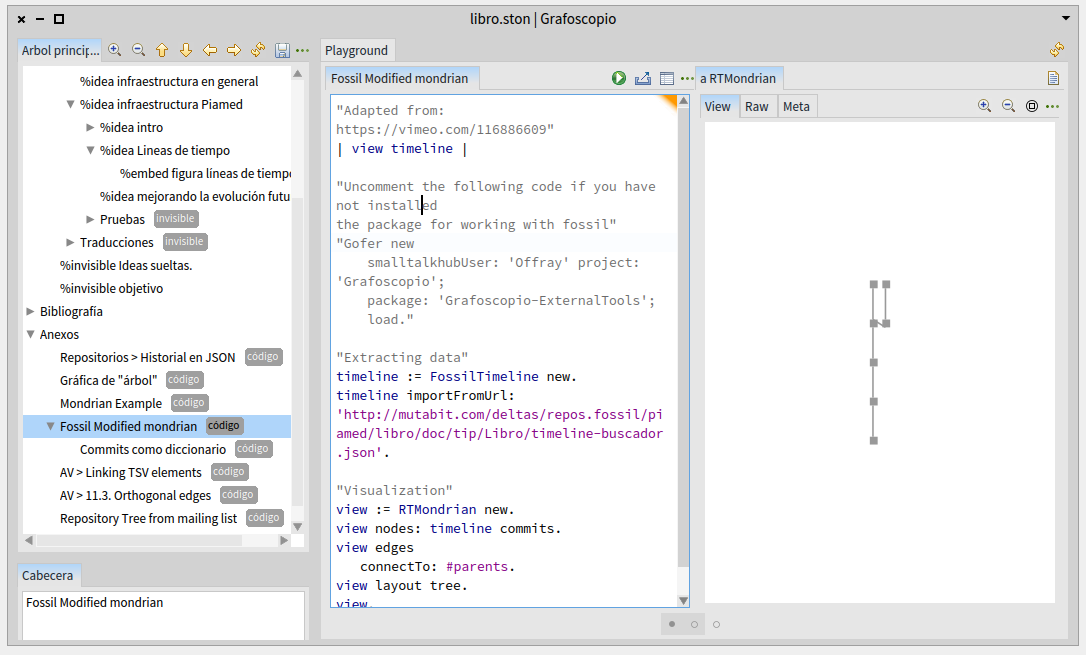
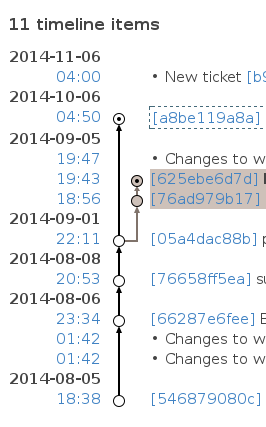
Hi again :), I would like to start a new exploration: How to change the color of the nodes in the RTMondrian view. The examples in the agile visualization book are with RTView, and I have seen some examples at the object profile gallery, but I would like to start with something simpler. So if I have the code running at [1], how can I change the color of the nodes on the tree to reflect some property of the node? [1] http://ws.stfx.eu/Q4I6UO67ZM4P Cheers, Offray Ps: By the way, inspired by Wolfram's Tweet a Program (https://twitter.com/wolframtap/) and Sven's elegant code examples, I'm trying to "package and share" some examples of the knowledge we build here to the external world in Twitter with the hashtag #PharoTip. Something like See for example: https://twitter.com/offrayLC/status/612409697975599104 On 20/06/15 13:44, Offray Vladimir Luna Cárdenas wrote:
Thanks Alexandre and Nicolai,
Now with a modified version of the script at http://ws.stfx.eu/AOPPDKEGTVFG I get the result below at the left, which has practically the same topology of the original fossil timeline tree below at right. Now I would like to change the edge length so it can convey commit date information (when commit happens) and look even more similar. I will make some test with RTMultiLine and orthoVertical shapes for edges, but any pointer to edge length variation and node distance examples will be greatly appreciated.
Finally about why "parents" instead of "parent" I try to use the same terms in the Json file export for the properties imported in the object. I imagine that if a commit is a merge of several branches, it could have several parents. I will test with more complicated trees to test if this case prompts.
Cheers,
Offray
On 20/06/15 12:46, Alexandre Bergel wrote:
Hi Offray,
The problem is rather easy to solve. Consider this script:
-=-=-=-=-=-=-=-=-=-=-=-= timeline := FossilTimeline new. timeline importFromUrl: 'http://mutabit.com/deltas/repos.fossil/piamed/libro/doc/tip/Libro/timeline-b...'.
"Visualization" view := RTMondrian new. view nodes: timeline commits. view edges connectFrom: #parents. view layout tree. view. -=-=-=-=-=-=-=-=-=-=-=-=
Apparently, each fossil commit has a parent. The parent could be nil (which is okay). Why do you call the variable âparentsâ and not âparentâ ?
Cheers, Alexandre
On Jun 19, 2015, at 9:41 AM, Offray Vladimir Luna Cárdenas<offray@riseup.net> wrote:
Alexandre,
Could you please run this:
~~~~~~~~~ "Adapted from:https://vimeo.com/116886609" | view timeline |
"Loading package for working with fossil" "Integration with external tools" Gofer new smalltalkhubUser: 'Offray' project: 'Grafoscopio'; package: 'Grafoscopio-ExternalTools'; load.
"Extracting data" timeline := FossilTimeline new. timeline importFromUrl: 'http://mutabit.com/deltas/repos.fossil/piamed/libro/doc/tip/Libro/timeline-b...'.
"Visualization" view := RTMondrian new. view nodes: timeline commits. view edges connectFrom: [#parents first]. view layout tree. view. "(timeline commits at: 1) parents first" ~~~~~~~~~
At the end you will get a set of squares visualized like this ones:
<jcjdcjje..png> ^Up Graphic 1: Trying to understand edges.
These squares are representations of FossilCommits objects imported from a Json file, and the "connectFrom: [#parents first]" is the line I'm having problems with. "#parents first" is the message I send to each node to know its parents in that very collection of commits, so I imagined that if I put that as the block argument for "connectFrom" I would get a nice tree, similar to the graphic 2 below. I don't get what's happening here or what I'm missing.
<cfbfiagc..png> ^ Up Graphic 2: A nicely drawn mondrian tree layout for RTLayout.
Any help on how to get tree like visualizations for this Fossil objects would be greatly appreciated.
Thanks,
Offray
Ps: Something was happening with ws.stfx.eu this morning at 7:00 (GMT -5) and trying to publish a workspace gives a 500 error.
On 16/06/15 16:08, Alexandre Bergel wrote:
I am not really following. Hard to guess here.
Can you make the image accessible for me? I can then have a closer look at it.
Alexandre
On Jun 15, 2015, at 3:18 PM, Offray Vladimir Luna Cárdenas<offray@riseup.net> wrote:
Hi all. Is me again :),
I have being fighting all this morning trying to bet a better understanding of edge connections and tree layouts. I'm making some progress, but still I don't grasp it. At [1] you can find my starting example. So far, so good, so I created my own variation for my own data at [2]. My main issue is the #connectFrom message argument. If you uncomment the last line of [1] you will see that sending the #superclass message gives me an object that is of the same kind that the ones have been added to the view previously and I imagine that the reason they can be connected in a tree. With the example at [2] the message [#parents first] gives me a fossil commit object, but if I ran the code, the nodes are unconnected. What I'm missing?
[1] http://ws.stfx.eu/DK3VNXBVAHXF
[2] http://ws.stfx.eu/DHF4VIR8TSPC
Thanks,
Offray
On 15/06/15 06:47, Offray Vladimir Luna Cárdenas wrote:
Hi Peter,
Thanks for your quick answer. I was pretty curious about trying to implement some of this ideas, but only until today I had the proper time to do it. I ran your code and now I'm trying to translate the ideas on it to my problem: Drawing a tree for the story of a fossil repository.
First, using the procedure at [1] I was able to export a fossil commit repo history as Json and by running the script at [2] I was able to get a small set of dots, which represent dictionaries with all commit data, including ancestors for each node, like the attached screenshot shows. In the video at [3] at 1:06 min, seems that lays the key for my visualization, but for that I need to create a fossil commit object that can understand the #ancestor message. Because I already have them as dictionaries thanks to NeoJson, seems that I'm really close to get the visualization I'm looking for. I hope to work on it this morning and return to the list with data visualizations or more questions.
[1] http://stackoverflow.com/questions/30577090/how-to-export-fossil-scm-timelin...
[2] http://ws.stfx.eu/A5C8JJMA2HUK
[3] https://vimeo.com/116886609
Cheers,
Offray
On 02/06/15 05:09, Peter Uhnák wrote:
HI Offray,
I gave it a quick bash and come up with the following code. It's just a prototype and could be greatly simplified.
- MCVersionInfo ancestors for whatever reason returned empty array down the line (so its cut off at the end), but I didn't investigate the problem - edge building and possibly ancestor retrieval could be simplified with builders; I think RTMondrian has methods for it but can't remember exactly (agilevisualization mentioned RTGraphBuilder but that has been removed to my knowledge)
~~~~~~~~~~~~~~~ mc := MCSmalltalkhubRepository allInstances detect: [ :m | m project = 'Roassal2' ].
root := mc versionInfoFromFileNamed: mc readableFileNames first.
family := Set new. retriever := nil. retriever := [ :child | family add: child. child ancestors do: [ :a | retriever value: a ] ]. retriever value: root. obs := family asGroup.
v := RTView new. es := RTEllipse new size: 15; color: Color blue; elementsOn: obs. v addAll: es.
edges := RTEdge buildEdgesFromObjects: obs from: #yourself toAll: #ancestors using: (RTArrowedLine new withShorterDistanceAttachPoint; color: Color red) scope: es. v addAll: edges.
es @ RTDraggable. es @ (RTLabelled new text: [ :m | m nameWithout: 'Roassal2' ]).
v @ RTDraggableView. v @ RTZoomableView.
RTDominanceTreeLayout new verticalGap: 30; horizontalGap: 15; on: es.
v open ~~~~~~~~~~~~~~~~
<Mail Attachment.png>
Cheers, Peter â
On Tue, Jun 2, 2015 at 5:39 AM, Offray Vladimir Luna Cárdenas <offray@riseup.net> wrote: Hi,
On a closer detail, seems that [1] contains the starting point I'm looking for. I'll keep you posted and of course any other approach will be listened.
[1] https://dl.dropboxusercontent.com/u/31543901/AgileVisualization/Roassal/0104...
Cheers,
Offray
On 01/06/15 22:04, Offray Vladimir Luna Cárdenas wrote: Hi all,
I had asked a similar question before with no much advances, but today I made a discovery that can improve the things a lot: how to export timeline data as structured JSON [1] (and of course this open the possibility to work with it on Pharo). Now I would like to graph the data as a tree with forks, merges and dates and authors of commits. I have seen chronia, but seems overkill for this feature (and is integrated with CVS only).
[1] http://stackoverflow.com/questions/30577090/how-to-export-fossil-scm-timelin...
As usual, any pointer on how to get this going will be greatly appreciated and I will give feedback to the community on how to do it.
Cheers,
Offray
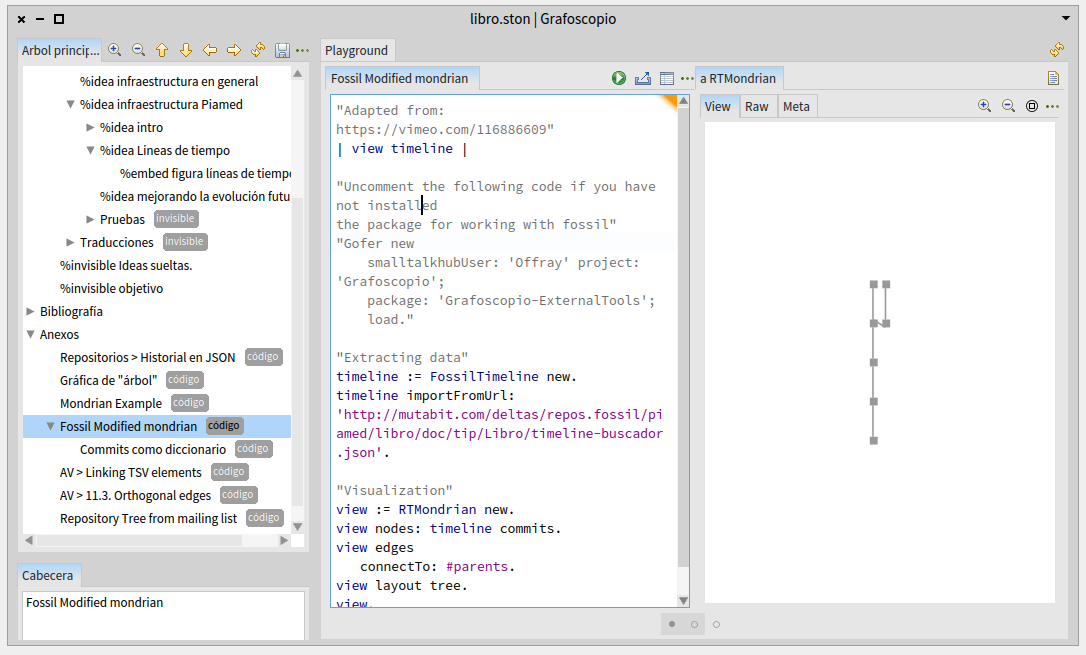
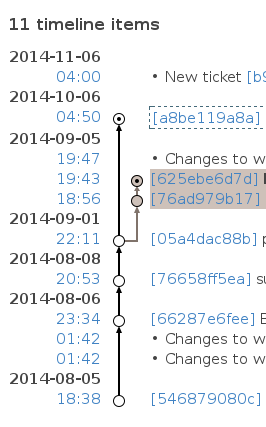
Hi Offray, Rather easy. Simply use a new shape. For example: -=-=-=-= b := RTMondrian new. b shape circle size: [ :cls | cls numberOfMethods log * 10 ]; color: (Color red alpha: 0.5). b nodes: RTObject withAllSubclasses. b layout flow. b -=-=-=-= Another example: -=-=-=-= classes := RTObject withAllSubclasses. largestNumberOfMethods := (classes collect: #numberOfMethods) max. colorNormalizer := RTMultiLinearColor new colors: (ColorPalette sequential colors: 8 scheme: 'Reds'); command: [ :cls | cls numberOfMethods / largestNumberOfMethods ]. b := RTMondrian new. b shape circle size: [ :cls | cls numberOfMethods log * 10 ]; color: colorNormalizer. b nodes: classes. b layout flow. b -=-=-=-= Many more example are available in the mondrian example class. Have you tried: RTMondrianExample inspect ? Cheers, Alexandre
On Jun 20, 2015, at 9:03 PM, Offray Vladimir Luna Cárdenas <offray@riseup.net> wrote:
Hi again :),
I would like to start a new exploration: How to change the color of the nodes in the RTMondrian view. The examples in the agile visualization book are with RTView, and I have seen some examples at the object profile gallery, but I would like to start with something simpler. So if I have the code running at [1], how can I change the color of the nodes on the tree to reflect some property of the node?
[1] http://ws.stfx.eu/Q4I6UO67ZM4P
Cheers,
Offray
Ps: By the way, inspired by Wolfram's Tweet a Program (https://twitter.com/wolframtap/) and Sven's elegant code examples, I'm trying to "package and share" some examples of the knowledge we build here to the external world in Twitter with the hashtag #PharoTip. Something like See for example: https://twitter.com/offrayLC/status/612409697975599104
On 20/06/15 13:44, Offray Vladimir Luna Cárdenas wrote:
Thanks Alexandre and Nicolai,
Now with a modified version of the script at http://ws.stfx.eu/AOPPDKEGTVFG I get the result below at the left, which has practically the same topology of the original fossil timeline tree below at right. Now I would like to change the edge length so it can convey commit date information (when commit happens) and look even more similar. I will make some test with RTMultiLine and orthoVertical shapes for edges, but any pointer to edge length variation and node distance examples will be greatly appreciated.
Finally about why "parents" instead of "parent" I try to use the same terms in the Json file export for the properties imported in the object. I imagine that if a commit is a merge of several branches, it could have several parents. I will test with more complicated trees to test if this case prompts.
<Mail Attachment.png><Mail Attachment.png>
Cheers,
Offray
On 20/06/15 12:46, Alexandre Bergel wrote:
Hi Offray,
The problem is rather easy to solve. Consider this script:
-=-=-=-=-=-=-=-=-=-=-=-= timeline := FossilTimeline new. timeline importFromUrl: ' http://mutabit.com/deltas/repos.fossil/piamed/libro/doc/tip/Libro/timeline-b... '.
"Visualization" view := RTMondrian new. view nodes: timeline commits. view edges connectFrom: #parents. view layout tree. view. -=-=-=-=-=-=-=-=-=-=-=-=
Apparently, each fossil commit has a parent. The parent could be nil (which is okay). Why do you call the variable âparentsâ and not âparentâ ?
Cheers, Alexandre
On Jun 19, 2015, at 9:41 AM, Offray Vladimir Luna Cárdenas <offray@riseup.net> wrote:
Alexandre,
Could you please run this:
~~~~~~~~~ "Adapted from: https://vimeo.com/116886609 " | view timeline |
"Loading package for working with fossil" "Integration with external tools" Gofer new smalltalkhubUser: 'Offray' project: 'Grafoscopio'; package: 'Grafoscopio-ExternalTools'; load.
"Extracting data" timeline := FossilTimeline new. timeline importFromUrl: ' http://mutabit.com/deltas/repos.fossil/piamed/libro/doc/tip/Libro/timeline-b... '.
"Visualization" view := RTMondrian new. view nodes: timeline commits. view edges connectFrom: [#parents first]. view layout tree. view. "(timeline commits at: 1) parents first" ~~~~~~~~~
At the end you will get a set of squares visualized like this ones:
<jcjdcjje..png> ^Up Graphic 1: Trying to understand edges.
These squares are representations of FossilCommits objects imported from a Json file, and the "connectFrom: [#parents first]" is the line I'm having problems with. "#parents first" is the message I send to each node to know its parents in that very collection of commits, so I imagined that if I put that as the block argument for "connectFrom" I would get a nice tree, similar to the graphic 2 below. I don't get what's happening here or what I'm missing.
<cfbfiagc..png> ^ Up Graphic 2: A nicely drawn mondrian tree layout for RTLayout.
Any help on how to get tree like visualizations for this Fossil objects would be greatly appreciated.
Thanks,
Offray
Ps: Something was happening with ws.stfx.eu this morning at 7:00 (GMT -5) and trying to publish a workspace gives a 500 error.
On 16/06/15 16:08, Alexandre Bergel wrote:
I am not really following. Hard to guess here.
Can you make the image accessible for me? I can then have a closer look at it.
Alexandre
On Jun 15, 2015, at 3:18 PM, Offray Vladimir Luna Cárdenas <offray@riseup.net>
wrote:
Hi all. Is me again :),
I have being fighting all this morning trying to bet a better understanding of edge connections and tree layouts. I'm making some progress, but still I don't grasp it. At [1] you can find my starting example. So far, so good, so I created my own variation for my own data at [2]. My main issue is the #connectFrom message argument. If you uncomment the last line of [1] you will see that sending the #superclass message gives me an object that is of the same kind that the ones have been added to the view previously and I imagine that the reason they can be connected in a tree. With the example at [2] the message [#parents first] gives me a fossil commit object, but if I ran the code, the nodes are unconnected. What I'm missing?
[1]
http://ws.stfx.eu/DK3VNXBVAHXF
[2]
http://ws.stfx.eu/DHF4VIR8TSPC
Thanks,
Offray
On 15/06/15 06:47, Offray Vladimir Luna Cárdenas wrote:
Hi Peter,
Thanks for your quick answer. I was pretty curious about trying to implement some of this ideas, but only until today I had the proper time to do it. I ran your code and now I'm trying to translate the ideas on it to my problem: Drawing a tree for the story of a fossil repository.
First, using the procedure at [1] I was able to export a fossil commit repo history as Json and by running the script at [2] I was able to get a small set of dots, which represent dictionaries with all commit data, including ancestors for each node, like the attached screenshot shows. In the video at [3] at 1:06 min, seems that lays the key for my visualization, but for that I need to create a fossil commit object that can understand the #ancestor message. Because I already have them as dictionaries thanks to NeoJson, seems that I'm really close to get the visualization I'm looking for. I hope to work on it this morning and return to the list with data visualizations or more questions.
[1]
http://stackoverflow.com/questions/30577090/how-to-export-fossil-scm-timelin...
[2]
http://ws.stfx.eu/A5C8JJMA2HUK
[3]
Cheers,
Offray
On 02/06/15 05:09, Peter Uhnák wrote:
HI Offray,
I gave it a quick bash and come up with the following code. It's just a prototype and could be greatly simplified.
- MCVersionInfo ancestors for whatever reason returned empty array down the line (so its cut off at the end), but I didn't investigate the problem - edge building and possibly ancestor retrieval could be simplified with builders; I think RTMondrian has methods for it but can't remember exactly (agilevisualization mentioned RTGraphBuilder but that has been removed to my knowledge)
~~~~~~~~~~~~~~~ mc := MCSmalltalkhubRepository allInstances detect: [ :m | m project = 'Roassal2' ].
root := mc versionInfoFromFileNamed: mc readableFileNames first.
family := Set new. retriever := nil. retriever := [ :child | family add: child. child ancestors do: [ :a | retriever value: a ] ]. retriever value: root. obs := family asGroup.
v := RTView new. es := RTEllipse new size: 15; color: Color blue; elementsOn: obs. v addAll: es.
edges := RTEdge buildEdgesFromObjects: obs from: #yourself toAll: #ancestors using: (RTArrowedLine new withShorterDistanceAttachPoint; color: Color red) scope: es. v addAll: edges.
es @ RTDraggable. es @ (RTLabelled new text: [ :m | m nameWithout: 'Roassal2' ]).
v @ RTDraggableView. v @ RTZoomableView.
RTDominanceTreeLayout new verticalGap: 30; horizontalGap: 15; on: es.
v open ~~~~~~~~~~~~~~~~
<Mail Attachment.png>
Cheers, Peter â
On Tue, Jun 2, 2015 at 5:39 AM, Offray Vladimir Luna Cárdenas
<offray@riseup.net>
wrote: Hi,
On a closer detail, seems that [1] contains the starting point I'm looking for. I'll keep you posted and of course any other approach will be listened.
[1]
https://dl.dropboxusercontent.com/u/31543901/AgileVisualization/Roassal/0104...
Cheers,
Offray
On 01/06/15 22:04, Offray Vladimir Luna Cárdenas wrote: Hi all,
I had asked a similar question before with no much advances, but today I made a discovery that can improve the things a lot: how to export timeline data as structured JSON [1] (and of course this open the possibility to work with it on Pharo). Now I would like to graph the data as a tree with forks, merges and dates and authors of commits. I have seen chronia, but seems overkill for this feature (and is integrated with CVS only).
[1]
http://stackoverflow.com/questions/30577090/how-to-export-fossil-scm-timelin...
As usual, any pointer on how to get this going will be greatly appreciated and I will give feedback to the community on how to do it.
Cheers,
Offray
-- _,.;:~^~:;._,.;:~^~:;._,.;:~^~:;._,.;:~^~:;._,.;: Alexandre Bergel http://www.bergel.eu ^~:;._,.;:~^~:;._,.;:~^~:;._,.;:~^~:;._,.;:~^~:;.
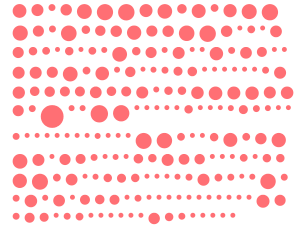
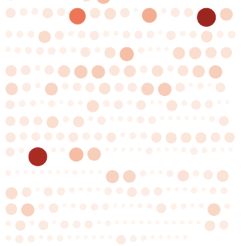
Hi I do not recommend to use Mondrian for doing what you need. Actually, I suggest to make your own layout. You may want to check the following code example: -=-=-=-=-=-=-=-=-= classes := RTShape withAllSubclasses. oldestAge := (classes collect: #ageInDays) max. v := RTView new. v @ RTDraggableView. classes doWithIndex: [ :c :index | elements := RTEllipse new elementsOn: c methods. v addAll: elements. RTMetricNormalizer new elements: elements; normalizeX: #ageInDaysAsInteger min: 0 max: 200 minValue: 0 maxValue: oldestAge. elements translateBy: 0 @ (index * 10). RTEdgeBuilder new view: v; linkElements: elements. ]. v -=-=-=-=-=-=-=-=-= I guess it is kind of close of what you need. Cheers, Alexandre
On Jun 20, 2015, at 3:44 PM, Offray Vladimir Luna Cárdenas <offray@riseup.net> wrote:
Thanks Alexandre and Nicolai,
Now with a modified version of the script at http://ws.stfx.eu/AOPPDKEGTVFG I get the result below at the left, which has practically the same topology of the original fossil timeline tree below at right. Now I would like to change the edge length so it can convey commit date information (when commit happens) and look even more similar. I will make some test with RTMultiLine and orthoVertical shapes for edges, but any pointer to edge length variation and node distance examples will be greatly appreciated.
Finally about why "parents" instead of "parent" I try to use the same terms in the Json file export for the properties imported in the object. I imagine that if a commit is a merge of several branches, it could have several parents. I will test with more complicated trees to test if this case prompts.
<abjfehfd..png><jfbdfbaj..png>
Cheers,
Offray
On 20/06/15 12:46, Alexandre Bergel wrote:
Hi Offray,
The problem is rather easy to solve. Consider this script:
-=-=-=-=-=-=-=-=-=-=-=-= timeline := FossilTimeline new. timeline importFromUrl: ' http://mutabit.com/deltas/repos.fossil/piamed/libro/doc/tip/Libro/timeline-b... '.
"Visualization" view := RTMondrian new. view nodes: timeline commits. view edges connectFrom: #parents. view layout tree. view. -=-=-=-=-=-=-=-=-=-=-=-=
Apparently, each fossil commit has a parent. The parent could be nil (which is okay). Why do you call the variable âparentsâ and not âparentâ ?
Cheers, Alexandre
On Jun 19, 2015, at 9:41 AM, Offray Vladimir Luna Cárdenas <offray@riseup.net> wrote:
Alexandre,
Could you please run this:
~~~~~~~~~ "Adapted from: https://vimeo.com/116886609 " | view timeline |
"Loading package for working with fossil" "Integration with external tools" Gofer new smalltalkhubUser: 'Offray' project: 'Grafoscopio'; package: 'Grafoscopio-ExternalTools'; load.
"Extracting data" timeline := FossilTimeline new. timeline importFromUrl: ' http://mutabit.com/deltas/repos.fossil/piamed/libro/doc/tip/Libro/timeline-b... '.
"Visualization" view := RTMondrian new. view nodes: timeline commits. view edges connectFrom: [#parents first]. view layout tree. view. "(timeline commits at: 1) parents first" ~~~~~~~~~
At the end you will get a set of squares visualized like this ones:
<jcjdcjje..png> ^Up Graphic 1: Trying to understand edges.
These squares are representations of FossilCommits objects imported from a Json file, and the "connectFrom: [#parents first]" is the line I'm having problems with. "#parents first" is the message I send to each node to know its parents in that very collection of commits, so I imagined that if I put that as the block argument for "connectFrom" I would get a nice tree, similar to the graphic 2 below. I don't get what's happening here or what I'm missing.
<cfbfiagc..png> ^ Up Graphic 2: A nicely drawn mondrian tree layout for RTLayout.
Any help on how to get tree like visualizations for this Fossil objects would be greatly appreciated.
Thanks,
Offray
Ps: Something was happening with ws.stfx.eu this morning at 7:00 (GMT -5) and trying to publish a workspace gives a 500 error.
On 16/06/15 16:08, Alexandre Bergel wrote:
I am not really following. Hard to guess here.
Can you make the image accessible for me? I can then have a closer look at it.
Alexandre
On Jun 15, 2015, at 3:18 PM, Offray Vladimir Luna Cárdenas <offray@riseup.net>
wrote:
Hi all. Is me again :),
I have being fighting all this morning trying to bet a better understanding of edge connections and tree layouts. I'm making some progress, but still I don't grasp it. At [1] you can find my starting example. So far, so good, so I created my own variation for my own data at [2]. My main issue is the #connectFrom message argument. If you uncomment the last line of [1] you will see that sending the #superclass message gives me an object that is of the same kind that the ones have been added to the view previously and I imagine that the reason they can be connected in a tree. With the example at [2] the message [#parents first] gives me a fossil commit object, but if I ran the code, the nodes are unconnected. What I'm missing?
[1]
http://ws.stfx.eu/DK3VNXBVAHXF
[2]
http://ws.stfx.eu/DHF4VIR8TSPC
Thanks,
Offray
On 15/06/15 06:47, Offray Vladimir Luna Cárdenas wrote:
Hi Peter,
Thanks for your quick answer. I was pretty curious about trying to implement some of this ideas, but only until today I had the proper time to do it. I ran your code and now I'm trying to translate the ideas on it to my problem: Drawing a tree for the story of a fossil repository.
First, using the procedure at [1] I was able to export a fossil commit repo history as Json and by running the script at [2] I was able to get a small set of dots, which represent dictionaries with all commit data, including ancestors for each node, like the attached screenshot shows. In the video at [3] at 1:06 min, seems that lays the key for my visualization, but for that I need to create a fossil commit object that can understand the #ancestor message. Because I already have them as dictionaries thanks to NeoJson, seems that I'm really close to get the visualization I'm looking for. I hope to work on it this morning and return to the list with data visualizations or more questions.
[1]
http://stackoverflow.com/questions/30577090/how-to-export-fossil-scm-timelin...
[2]
http://ws.stfx.eu/A5C8JJMA2HUK
[3]
Cheers,
Offray
On 02/06/15 05:09, Peter Uhnák wrote:
HI Offray,
I gave it a quick bash and come up with the following code. It's just a prototype and could be greatly simplified.
- MCVersionInfo ancestors for whatever reason returned empty array down the line (so its cut off at the end), but I didn't investigate the problem - edge building and possibly ancestor retrieval could be simplified with builders; I think RTMondrian has methods for it but can't remember exactly (agilevisualization mentioned RTGraphBuilder but that has been removed to my knowledge)
~~~~~~~~~~~~~~~ mc := MCSmalltalkhubRepository allInstances detect: [ :m | m project = 'Roassal2' ].
root := mc versionInfoFromFileNamed: mc readableFileNames first.
family := Set new. retriever := nil. retriever := [ :child | family add: child. child ancestors do: [ :a | retriever value: a ] ]. retriever value: root. obs := family asGroup.
v := RTView new. es := RTEllipse new size: 15; color: Color blue; elementsOn: obs. v addAll: es.
edges := RTEdge buildEdgesFromObjects: obs from: #yourself toAll: #ancestors using: (RTArrowedLine new withShorterDistanceAttachPoint; color: Color red) scope: es. v addAll: edges.
es @ RTDraggable. es @ (RTLabelled new text: [ :m | m nameWithout: 'Roassal2' ]).
v @ RTDraggableView. v @ RTZoomableView.
RTDominanceTreeLayout new verticalGap: 30; horizontalGap: 15; on: es.
v open ~~~~~~~~~~~~~~~~
<Mail Attachment.png>
Cheers, Peter â
On Tue, Jun 2, 2015 at 5:39 AM, Offray Vladimir Luna Cárdenas
<offray@riseup.net>
wrote: Hi,
On a closer detail, seems that [1] contains the starting point I'm looking for. I'll keep you posted and of course any other approach will be listened.
[1]
https://dl.dropboxusercontent.com/u/31543901/AgileVisualization/Roassal/0104...
Cheers,
Offray
On 01/06/15 22:04, Offray Vladimir Luna Cárdenas wrote: Hi all,
I had asked a similar question before with no much advances, but today I made a discovery that can improve the things a lot: how to export timeline data as structured JSON [1] (and of course this open the possibility to work with it on Pharo). Now I would like to graph the data as a tree with forks, merges and dates and authors of commits. I have seen chronia, but seems overkill for this feature (and is integrated with CVS only).
[1]
http://stackoverflow.com/questions/30577090/how-to-export-fossil-scm-timelin...
As usual, any pointer on how to get this going will be greatly appreciated and I will give feedback to the community on how to do it.
Cheers,
Offray
-- _,.;:~^~:;._,.;:~^~:;._,.;:~^~:;._,.;:~^~:;._,.;: Alexandre Bergel http://www.bergel.eu ^~:;._,.;:~^~:;._,.;:~^~:;._,.;:~^~:;._,.;:~^~:;.
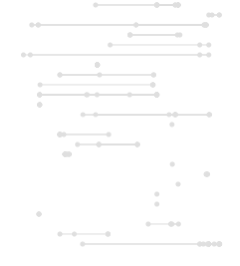
participants (7)
-
 Alexandre Bergel
 -
 Nicolai Hess
 -
 Offray Vladimir Luna Cárdenas
 -
 Peter Uhnák
 -
 Sven Van Caekenberghe
 -
 Thierry Goubier
 -
 Tudor Girba