How does the SUnit debug view, highlight lower down in the stack?

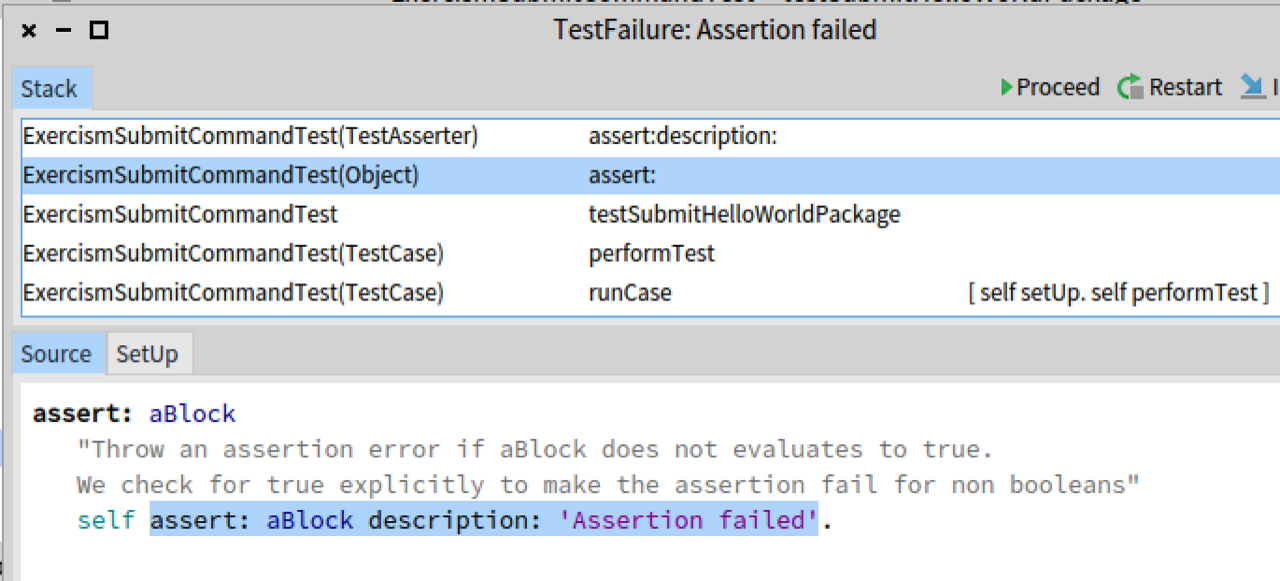
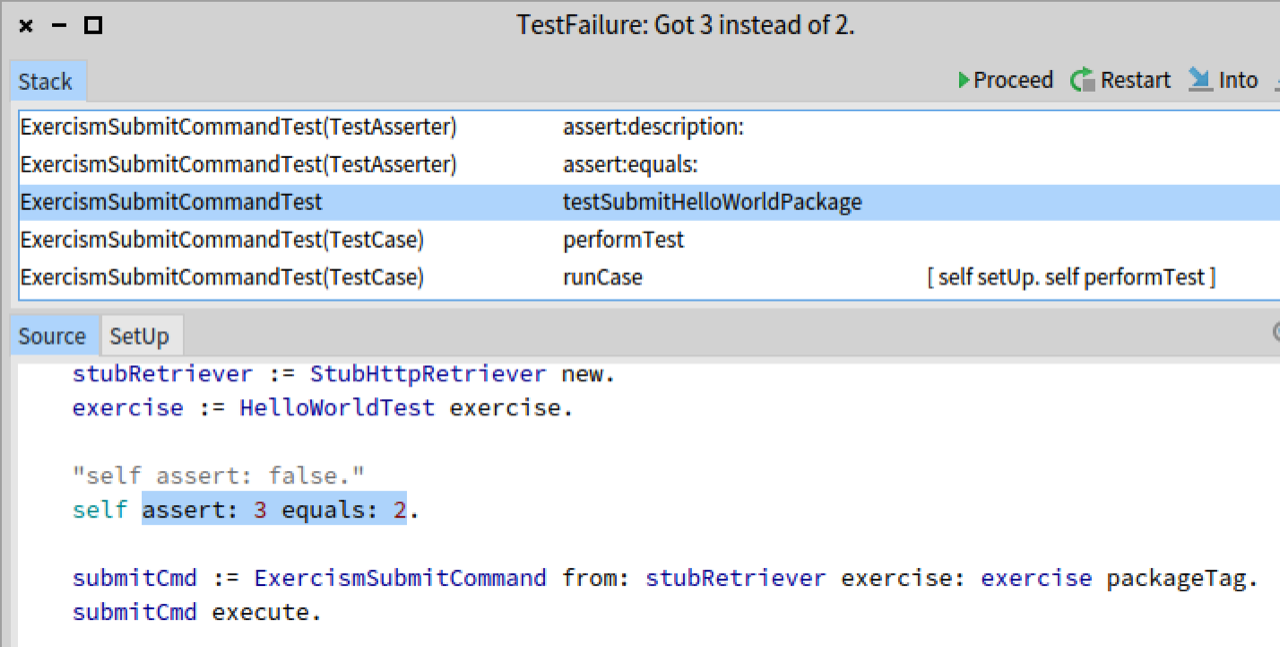
Iâve been working on improving some of my testing techniques and the tools used to do that, and it highlighted something where Iâm not clear on how it works. Sometime the debugger highlights a failure lower down in the stack (not just the stack frame directly below the signaller). How does it do it? I canât see what it does to achieve this - however curiously it differs between types of assert. I.e. with: self assert: 2 =3 (it just shows the frame below) Yet: self assert: 2 equals: 4 (shows two frames below, and actually directly shows where in the test failed - with no further clicks which is brilliant) The photos (at the end) demonstrate what I mean - and I can see there is a defaultAction in TestFailure that pops open the debugger: defaultAction Processor activeProcess debug: self signalerContext title: self description And if I try and do a similar thing for one of my own exceptions - but wind further down the stack manually (which TestFailure doesât do) like: defaultAction | triggerContext | triggerContext := self signalerContext findContextSuchThat: [ :context | context method selector = #doesNotUnderstand: ]. "Trigger the debugger where the failure happened" Processor activeProcess debug: (triggerContext ifNil: [ self signalerContext ]) title: self messageText This gives me a debugger on the line of the failure (which I like), but the stack above this failure (which in my case was many frames deep) is gone (presumably as contexts only know their parent, and Iâve backed up through the parent chain). This is a bit confusing to understand how you got the error. So Iâm left wondering how #assert:equals: ends up highlighting further down. Iâm missing some concept - and wondering if anyone knows? Itâs not urgent - but a smalltalkây curiosity about how our environment works. Tim The debugger that pops up for assert: vs. The debugger that pops up for #assert:equals:

On Mon, 11 Mar 2019 at 17:31, Tim Mackinnon <tim@testit.works> wrote:
Iâve been working on improving some of my testing techniques and the tools used to do that, and it highlighted something where Iâm not clear on how it works. Sometime the debugger highlights a failure lower down in the stack (not just the stack frame directly below the signaller).
How does it do it? I canât see what it does to achieve this - however curiously it differs between types of assert.
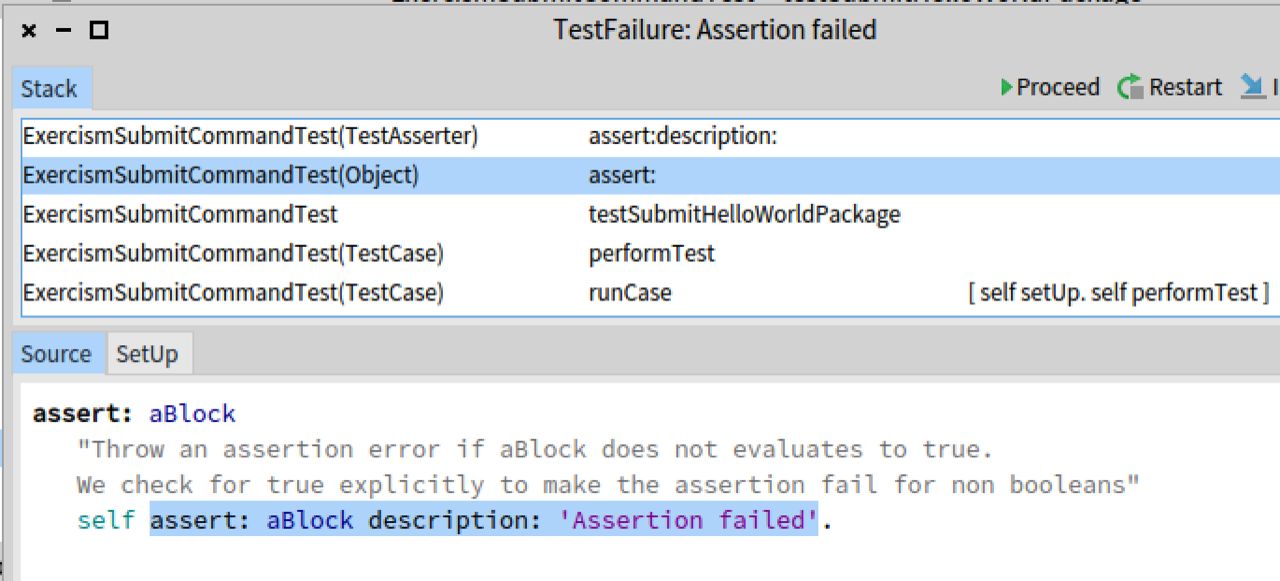
I.e. with: self assert: 2 =3 (it just shows the frame below)
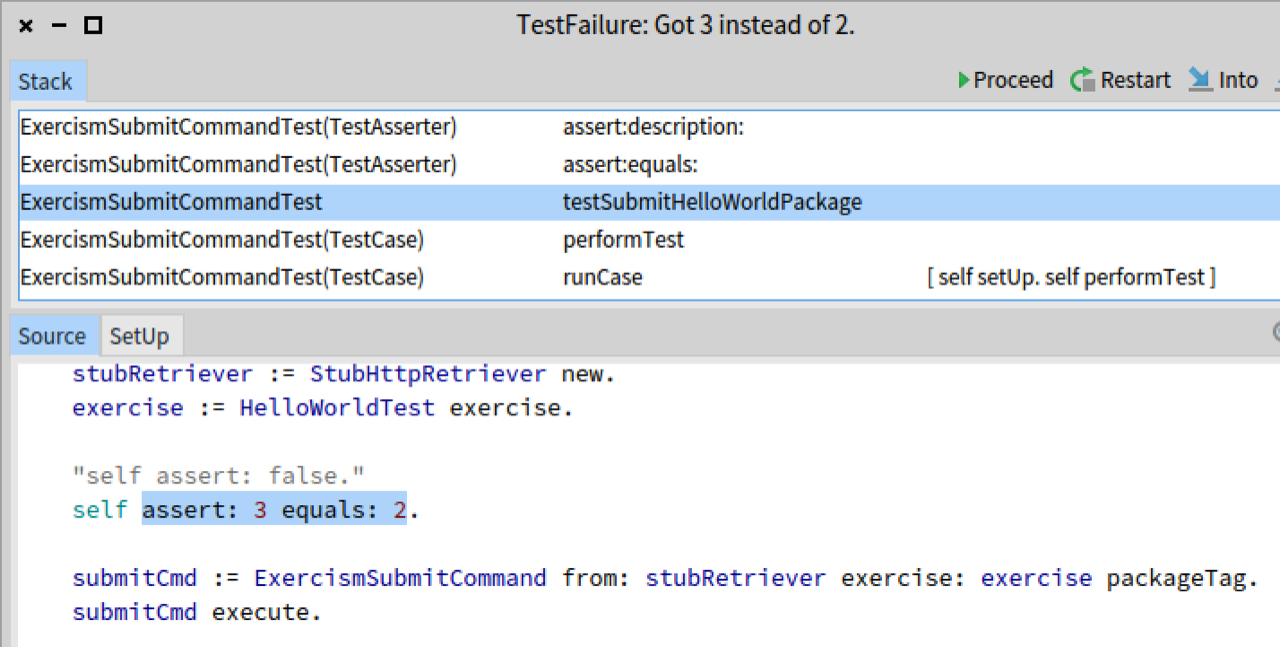
Yet: self assert: 2 equals: 4 (shows two frames below, and actually directly shows where in the test failed - with no further clicks which is brilliant)
The photos (at the end) demonstrate what I mean - and I can see there is a defaultAction in TestFailure that pops open the debugger:
defaultAction
Processor activeProcess debug: self signalerContext title: self description
And if I try and do a similar thing for one of my own exceptions - but wind further down the stack manually (which TestFailure doesât do) like:
defaultAction | triggerContext | triggerContext := self signalerContext findContextSuchThat: [ :context | context method selector = #doesNotUnderstand: ]. "Trigger the debugger where the failure happened" Processor activeProcess debug: (triggerContext ifNil: [ self signalerContext ]) title: self messageText
This gives me a debugger on the line of the failure (which I like), but the stack above this failure (which in my case was many frames deep) is gone (presumably as contexts only know their parent, and Iâve backed up through the parent chain). This is a bit confusing to understand how you got the error.
So Iâm left wondering how #assert:equals: ends up highlighting further down. Iâm missing some concept - and wondering if anyone knows? Itâs not urgent - but a smalltalkây curiosity about how our environment works.
I haven't dug deeply, but to get you started... using the following as a test case TestCase subclass: #ATest ... ATest >> test1 self assert: 2 =3 ATest >> test2 self assert: 2 equals: 4 If I run each by clicking on their test icons, the pre-debug windows look identical, so the difference occurs after clicking the <Debug> button. Leaving the windows untouched for a moment, and presuming its something to do with identifying the #assert:equals message, use the Finder to search Source for that message and put a "self haltOnce" of all the candidate methods. Then click one <Debug> button, and one of those "self haltOnce"s is triggered. Save that method again to reset the haltOnce, then click the other <Debug> button. Now side-by-side trace through both debuggers looking for differences in execution. cheers -ben
participants (2)
-
 Ben Coman
 -
 Tim Mackinnon