[Roassal3 Script of the day] Visualizing Coronavirus official public data

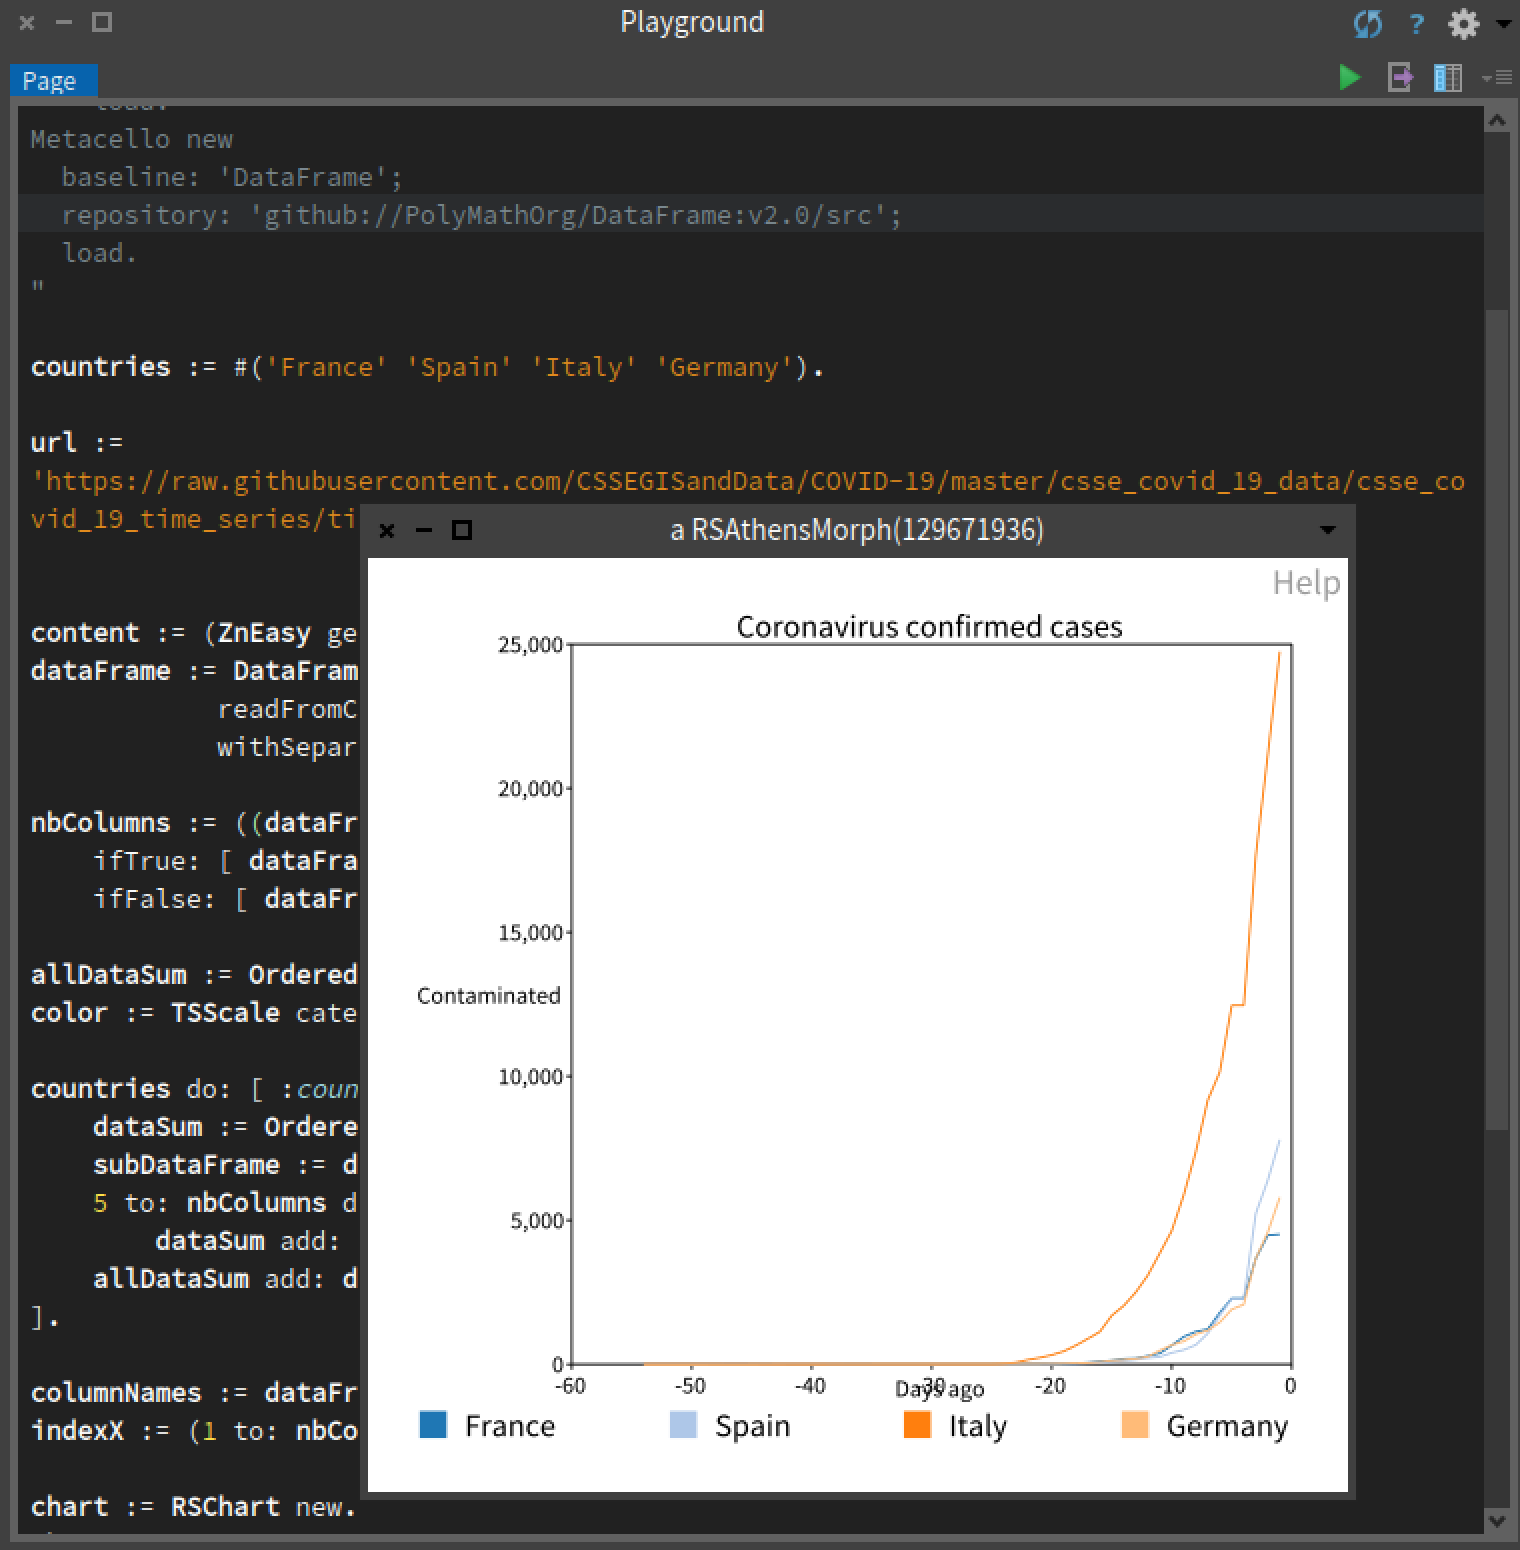
Hola, Here is a script, for which I hope some of you will find useful. The script of today visualize the number of infected and allows for an easily (and very basic) comparison. First, you need Roassal3 and DataFrame. Here is the code: -=-=-=-=-=-=-=-=-=-=-=-=-=-=-=-= Metacello new baseline: 'Roassal3'; repository: 'github://ObjectProfile/Roassal3'; load. Metacello new baseline: 'DataFrame'; repository: 'github://PolyMathOrg/DataFrame:v2.0/src'; load. -=-=-=-=-=-=-=-=-=-=-=-=-=-=-=-= Then, evaluate the Pharo code available on: -=-=-=-=-=-=-=-=-=-=-=-=-=-=-=-= https://gist.github.com/bergel/6ebcde9696ef922f2b519c56a4520bac -=-=-=-=-=-=-=-=-=-=-=-=-=-=-=-= You should then see the following: Change the names of the countries to see what you are interested in. Stay safe Alexandre -- _,.;:~^~:;._,.;:~^~:;._,.;:~^~:;._,.;:~^~:;._,.;: Alexandre Bergel http://www.bergel.eu ^~:;._,.;:~^~:;._,.;:~^~:;._,.;:~^~:;._,.;:~^~:;.
participants (1)
-
 Alexandre Bergel