Roassal Visualization for control flow graph issues

Hello Roassal developers, A few time ago Usman Bhatti showed me Roassal. Today I decided to use it for my daily work on a project that aims to optimize Pharo's methods. Firstly I am quite impressed by the quality of Roassal, I am currently using the Roassal + Mondrian builder and I have a visual representation which is very close to what I want after 1 hour of work with the help of Usman. Good job guys. Here are 2 examples of what I use: exampleIfTrueIfFalse2 | a b | a := true. a ifTrue: [ false ifTrue: [ ^ b := 1 ] ifFalse: [ b := 2 ] ] ifFalse: [ true ifTrue: [ b := 4 ] ifFalse: [ b := 5 ] ]. ^ b [image: Images intégrées 1] Here there's one rectangle for each basic block, entrance/exits are basic blocks with bigger borders, and borders in red represents the "hot path", which the path the execution flow most frequently uses (based on native code counters added at some spots in the method by Cogit). Another example: exampleToDo 1 to: 10 do: [ :i | self kick: i ] [image: Images intégrées 3] Now I have a few issues with the layout. I am currently using the narrowTreeLayout which seems to be the best for my visualisation. *issue 1:* When branches merges, which is in a tree when a node has 2 or more parents, or when I have a #ifTrue:ifFalse:, the child is not well aligned horizontally. Here in the first visualisation I showed, BasicBlock 5 is below but not in the middle of Basic block 8,7 and 4 (horizontally). I put a minimal width for each basic block to make it better but it's still not perfect. *issue 2:* (most important issue) I cannot display back jumps because then all the graph is missdrawn, therefore I need to remember where they are instead of visualizing them all the time (I cannot display the back jump from basic block 3 to basic block 2 in the second representation. In addition, the back jump edge, when well displayed, overlaps the basic blocks visualizations. Here is an example of what I would like for the edges and basic block positions: [image: Images intégrées 2] As you can see, here exit is in the middle of B2 and B5 horizontally, which is not the case in my roassal visualization. In addition, there's a back jump from B6 to B4 that I cannot display (or all the visual representation goes nuts). The edge for the back jump does not overlap with the basic blocks. In this graph, arrows follow a grid. I don't care that arrows are diagonals instead of a mix of horizontal and vertical lines but I would like to be able to see nicely the back jumps as in this graph. Do you have an idea on what layout/view options I could use with Roassal +Mondrian to have a better result ? I tried to create my own layout but after 2 hours I understood this cost too much time for my planning (or perhaps I'm just too dumb to do it fast :-( ). Anyway, the representation I have now is good enough for me to use it. But a better one would be better, especially for back jumps :-). Thanks for any help. Clement

Hi Clément, Thanks for your nice words. Layouts provided by Roassal are well known generic algorithm. Creating a new layout is not complicated at all. Just subclass ROLayout and override the hook methods. Creating a layout for your need is not easy. Have you tried to google for a layout? If you find one, it should be rather easy to implement it. Alexandre On Jan 14, 2014, at 12:50 PM, Clément Bera <bera.clement@gmail.com> wrote:
Hello Roassal developers,
A few time ago Usman Bhatti showed me Roassal. Today I decided to use it for my daily work on a project that aims to optimize Pharo's methods.
Firstly I am quite impressed by the quality of Roassal, I am currently using the Roassal + Mondrian builder and I have a visual representation which is very close to what I want after 1 hour of work with the help of Usman. Good job guys.
Here are 2 examples of what I use:
exampleIfTrueIfFalse2 | a b | a := true. a ifTrue: [ false ifTrue: [ ^ b := 1 ] ifFalse: [ b := 2 ] ] ifFalse: [ true ifTrue: [ b := 4 ] ifFalse: [ b := 5 ] ]. ^ b
<Screen Shot 2014-01-14 at 4.14.49 PM.png>
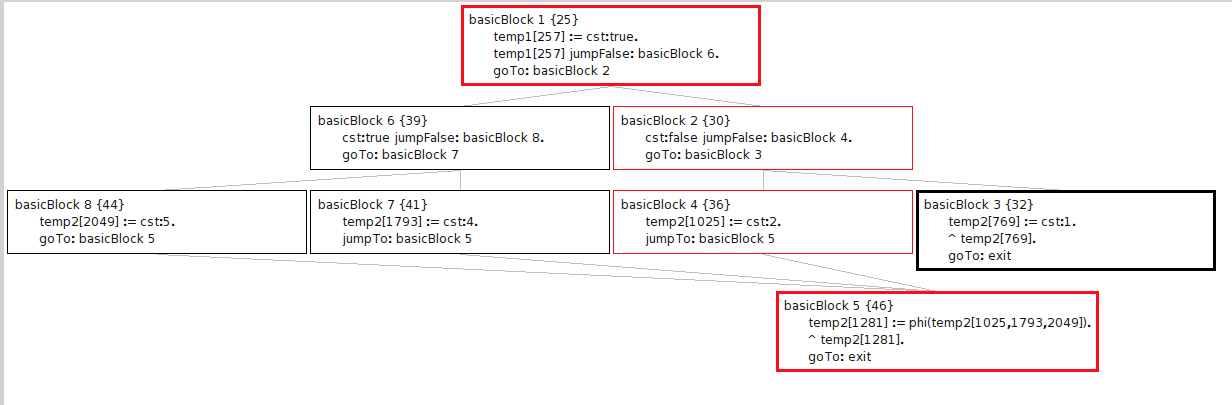
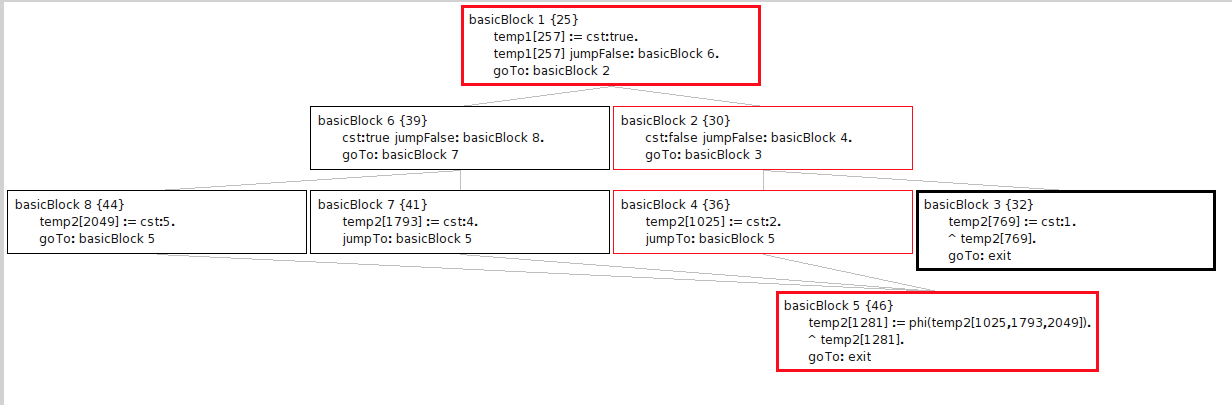
Here there's one rectangle for each basic block, entrance/exits are basic blocks with bigger borders, and borders in red represents the "hot path", which the path the execution flow most frequently uses (based on native code counters added at some spots in the method by Cogit).
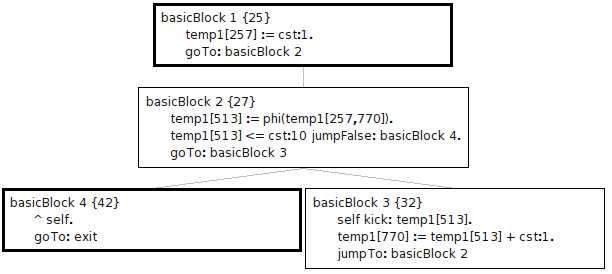
Another example:
exampleToDo
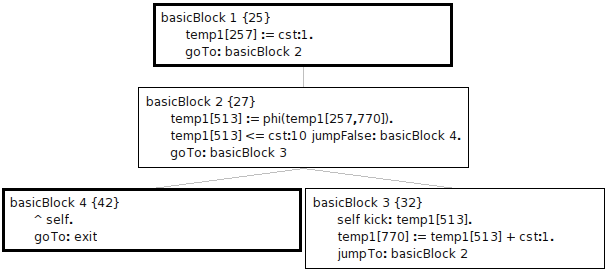
1 to: 10 do: [ :i | self kick: i ]
<Screen Shot 2014-01-14 at 4.36.47 PM.png>
Now I have a few issues with the layout. I am currently using the narrowTreeLayout which seems to be the best for my visualisation.
issue 1: When branches merges, which is in a tree when a node has 2 or more parents, or when I have a #ifTrue:ifFalse:, the child is not well aligned horizontally. Here in the first visualisation I showed, BasicBlock 5 is below but not in the middle of Basic block 8,7 and 4 (horizontally). I put a minimal width for each basic block to make it better but it's still not perfect. issue 2: (most important issue) I cannot display back jumps because then all the graph is missdrawn, therefore I need to remember where they are instead of visualizing them all the time (I cannot display the back jump from basic block 3 to basic block 2 in the second representation. In addition, the back jump edge, when well displayed, overlaps the basic blocks visualizations.
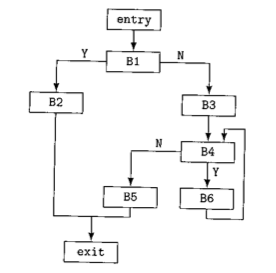
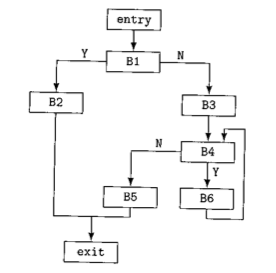
Here is an example of what I would like for the edges and basic block positions:
<Screen Shot 2014-01-14 at 4.27.32 PM.png>
As you can see, here exit is in the middle of B2 and B5 horizontally, which is not the case in my roassal visualization. In addition, there's a back jump from B6 to B4 that I cannot display (or all the visual representation goes nuts). The edge for the back jump does not overlap with the basic blocks. In this graph, arrows follow a grid. I don't care that arrows are diagonals instead of a mix of horizontal and vertical lines but I would like to be able to see nicely the back jumps as in this graph.
Do you have an idea on what layout/view options I could use with Roassal +Mondrian to have a better result ?
I tried to create my own layout but after 2 hours I understood this cost too much time for my planning (or perhaps I'm just too dumb to do it fast :-( ).
Anyway, the representation I have now is good enough for me to use it. But a better one would be better, especially for back jumps :-).
Thanks for any help.
Clement
-- _,.;:~^~:;._,.;:~^~:;._,.;:~^~:;._,.;:~^~:;._,.;: Alexandre Bergel http://www.bergel.eu ^~:;._,.;:~^~:;._,.;:~^~:;._,.;:~^~:;._,.;:~^~:;.

Alex, I remember to have talked to Mathieu about the making layouts ignore some edges when drawing visualizations and I think he gave it a try as well. I think that can be helpful in Clement's case (back jumps are ignored in the layout). Do you remember to have integrated something in Roassal on these lines from Mathieu's work? Usman On Tue, Jan 14, 2014 at 6:20 PM, Alexandre Bergel <alexandre.bergel@me.com>wrote:
Hi Clément,
Thanks for your nice words. Layouts provided by Roassal are well known generic algorithm. Creating a new layout is not complicated at all. Just subclass ROLayout and override the hook methods. Creating a layout for your need is not easy. Have you tried to google for a layout? If you find one, it should be rather easy to implement it.
Alexandre
On Jan 14, 2014, at 12:50 PM, Clément Bera <bera.clement@gmail.com> wrote:
Hello Roassal developers,
A few time ago Usman Bhatti showed me Roassal. Today I decided to use it for my daily work on a project that aims to optimize Pharo's methods.
Firstly I am quite impressed by the quality of Roassal, I am currently using the Roassal + Mondrian builder and I have a visual representation which is very close to what I want after 1 hour of work with the help of Usman. Good job guys.
Here are 2 examples of what I use:
exampleIfTrueIfFalse2 | a b | a := true. a ifTrue: [ false ifTrue: [ ^ b := 1 ] ifFalse: [ b := 2 ] ] ifFalse: [ true ifTrue: [ b := 4 ] ifFalse: [ b := 5 ] ]. ^ b
<Screen Shot 2014-01-14 at 4.14.49 PM.png>
Here there's one rectangle for each basic block, entrance/exits are basic blocks with bigger borders, and borders in red represents the "hot path", which the path the execution flow most frequently uses (based on native code counters added at some spots in the method by Cogit).
Another example:
exampleToDo
1 to: 10 do: [ :i | self kick: i ]
<Screen Shot 2014-01-14 at 4.36.47 PM.png>
Now I have a few issues with the layout. I am currently using the narrowTreeLayout which seems to be the best for my visualisation.
issue 1: When branches merges, which is in a tree when a node has 2 or more parents, or when I have a #ifTrue:ifFalse:, the child is not well aligned horizontally. Here in the first visualisation I showed, BasicBlock 5 is below but not in the middle of Basic block 8,7 and 4 (horizontally). I put a minimal width for each basic block to make it better but it's still not perfect. issue 2: (most important issue) I cannot display back jumps because then all the graph is missdrawn, therefore I need to remember where they are instead of visualizing them all the time (I cannot display the back jump from basic block 3 to basic block 2 in the second representation. In addition, the back jump edge, when well displayed, overlaps the basic blocks visualizations.
Here is an example of what I would like for the edges and basic block positions:
<Screen Shot 2014-01-14 at 4.27.32 PM.png>
As you can see, here exit is in the middle of B2 and B5 horizontally, which is not the case in my roassal visualization. In addition, there's a back jump from B6 to B4 that I cannot display (or all the visual representation goes nuts). The edge for the back jump does not overlap with the basic blocks. In this graph, arrows follow a grid. I don't care that arrows are diagonals instead of a mix of horizontal and vertical lines but I would like to be able to see nicely the back jumps as in this graph.
Do you have an idea on what layout/view options I could use with Roassal +Mondrian to have a better result ?
I tried to create my own layout but after 2 hours I understood this cost too much time for my planning (or perhaps I'm just too dumb to do it fast :-( ).
Anyway, the representation I have now is good enough for me to use it. But a better one would be better, especially for back jumps :-).
Thanks for any help.
Clement
-- _,.;:~^~:;._,.;:~^~:;._,.;:~^~:;._,.;:~^~:;._,.;: Alexandre Bergel http://www.bergel.eu ^~:;._,.;:~^~:;._,.;:~^~:;._,.;:~^~:;._,.;:~^~:;.

If you pass userDefinedEdges: to a graph layout, it will only consider those edges. This is what happens for example in the Meta Browser: the red arrows are not taken into account. Doru On Wed, Jan 15, 2014 at 3:32 PM, Usman Bhatti <usman.bhatti@gmail.com>wrote:
Alex,
I remember to have talked to Mathieu about the making layouts ignore some edges when drawing visualizations and I think he gave it a try as well. I think that can be helpful in Clement's case (back jumps are ignored in the layout). Do you remember to have integrated something in Roassal on these lines from Mathieu's work?
Usman
On Tue, Jan 14, 2014 at 6:20 PM, Alexandre Bergel <alexandre.bergel@me.com
wrote:
Hi Clément,
Thanks for your nice words. Layouts provided by Roassal are well known generic algorithm. Creating a new layout is not complicated at all. Just subclass ROLayout and override the hook methods. Creating a layout for your need is not easy. Have you tried to google for a layout? If you find one, it should be rather easy to implement it.
Alexandre
On Jan 14, 2014, at 12:50 PM, Clément Bera <bera.clement@gmail.com> wrote:
Hello Roassal developers,
A few time ago Usman Bhatti showed me Roassal. Today I decided to use it for my daily work on a project that aims to optimize Pharo's methods.
Firstly I am quite impressed by the quality of Roassal, I am currently using the Roassal + Mondrian builder and I have a visual representation which is very close to what I want after 1 hour of work with the help of Usman. Good job guys.
Here are 2 examples of what I use:
exampleIfTrueIfFalse2 | a b | a := true. a ifTrue: [ false ifTrue: [ ^ b := 1 ] ifFalse: [ b := 2 ] ] ifFalse: [ true ifTrue: [ b := 4 ] ifFalse: [ b := 5 ] ]. ^ b
<Screen Shot 2014-01-14 at 4.14.49 PM.png>
Here there's one rectangle for each basic block, entrance/exits are basic blocks with bigger borders, and borders in red represents the "hot path", which the path the execution flow most frequently uses (based on native code counters added at some spots in the method by Cogit).
Another example:
exampleToDo
1 to: 10 do: [ :i | self kick: i ]
<Screen Shot 2014-01-14 at 4.36.47 PM.png>
Now I have a few issues with the layout. I am currently using the narrowTreeLayout which seems to be the best for my visualisation.
issue 1: When branches merges, which is in a tree when a node has 2 or more parents, or when I have a #ifTrue:ifFalse:, the child is not well aligned horizontally. Here in the first visualisation I showed, BasicBlock 5 is below but not in the middle of Basic block 8,7 and 4 (horizontally). I put a minimal width for each basic block to make it better but it's still not perfect. issue 2: (most important issue) I cannot display back jumps because then all the graph is missdrawn, therefore I need to remember where they are instead of visualizing them all the time (I cannot display the back jump from basic block 3 to basic block 2 in the second representation. In addition, the back jump edge, when well displayed, overlaps the basic blocks visualizations.
Here is an example of what I would like for the edges and basic block positions:
<Screen Shot 2014-01-14 at 4.27.32 PM.png>
As you can see, here exit is in the middle of B2 and B5 horizontally, which is not the case in my roassal visualization. In addition, there's a back jump from B6 to B4 that I cannot display (or all the visual representation goes nuts). The edge for the back jump does not overlap with the basic blocks. In this graph, arrows follow a grid. I don't care that arrows are diagonals instead of a mix of horizontal and vertical lines but I would like to be able to see nicely the back jumps as in this graph.
Do you have an idea on what layout/view options I could use with Roassal +Mondrian to have a better result ?
I tried to create my own layout but after 2 hours I understood this cost too much time for my planning (or perhaps I'm just too dumb to do it fast :-( ).
Anyway, the representation I have now is good enough for me to use it. But a better one would be better, especially for back jumps :-).
Thanks for any help.
Clement
-- _,.;:~^~:;._,.;:~^~:;._,.;:~^~:;._,.;:~^~:;._,.;: Alexandre Bergel http://www.bergel.eu ^~:;._,.;:~^~:;._,.;:~^~:;._,.;:~^~:;._,.;:~^~:;.
-- www.tudorgirba.com "Every thing has its own flow"

Le 15/01/2014 17:07, Tudor Girba a écrit :
If you pass userDefinedEdges: to a graph layout, it will only consider those edges. This is what happens for example in the Meta Browser: the red arrows are not taken into account.
I'll keep track of that gem. Thierry
Doru
On Wed, Jan 15, 2014 at 3:32 PM, Usman Bhatti <usman.bhatti@gmail.com <mailto:usman.bhatti@gmail.com>> wrote:
Alex,
I remember to have talked to Mathieu about the making layouts ignore some edges when drawing visualizations and I think he gave it a try as well. I think that can be helpful in Clement's case (back jumps are ignored in the layout). Do you remember to have integrated something in Roassal on these lines from Mathieu's work?
Usman
On Tue, Jan 14, 2014 at 6:20 PM, Alexandre Bergel <alexandre.bergel@me.com <mailto:alexandre.bergel@me.com>> wrote:
Hi Clément,
Thanks for your nice words. Layouts provided by Roassal are well known generic algorithm. Creating a new layout is not complicated at all. Just subclass ROLayout and override the hook methods. Creating a layout for your need is not easy. Have you tried to google for a layout? If you find one, it should be rather easy to implement it.
Alexandre
On Jan 14, 2014, at 12:50 PM, Clément Bera <bera.clement@gmail.com <mailto:bera.clement@gmail.com>> wrote:
> Hello Roassal developers, > > A few time ago Usman Bhatti showed me Roassal. Today I decided to use it for my daily work on a project that aims to optimize Pharo's methods. > > Firstly I am quite impressed by the quality of Roassal, I am currently using the Roassal + Mondrian builder and I have a visual representation which is very close to what I want after 1 hour of work with the help of Usman. Good job guys. > > Here are 2 examples of what I use: > > exampleIfTrueIfFalse2 > | a b | > a := true. > a > ifTrue: [ > false ifTrue: [ ^ b := 1 ] ifFalse: [ b := 2 ] ] > ifFalse: [ > true ifTrue: [ b := 4 ] ifFalse: [ b := 5 ] ]. > ^ b > > <Screen Shot 2014-01-14 at 4.14.49 PM.png> > > Here there's one rectangle for each basic block, entrance/exits are basic blocks with bigger borders, and borders in red represents the "hot path", which the path the execution flow most frequently uses (based on native code counters added at some spots in the method by Cogit). > > Another example: > > exampleToDo > > 1 to: 10 do: [ :i | > self kick: i ] > > <Screen Shot 2014-01-14 at 4.36.47 PM.png> > > Now I have a few issues with the layout. I am currently using the narrowTreeLayout which seems to be the best for my visualisation. > > issue 1: When branches merges, which is in a tree when a node has 2 or more parents, or when I have a #ifTrue:ifFalse:, the child is not well aligned horizontally. Here in the first visualisation I showed, BasicBlock 5 is below but not in the middle of Basic block 8,7 and 4 (horizontally). I put a minimal width for each basic block to make it better but it's still not perfect. > issue 2: (most important issue) I cannot display back jumps because then all the graph is missdrawn, therefore I need to remember where they are instead of visualizing them all the time (I cannot display the back jump from basic block 3 to basic block 2 in the second representation. In addition, the back jump edge, when well displayed, overlaps the basic blocks visualizations. > > Here is an example of what I would like for the edges and basic block positions: > > <Screen Shot 2014-01-14 at 4.27.32 PM.png> > > As you can see, here exit is in the middle of B2 and B5 horizontally, which is not the case in my roassal visualization. > In addition, there's a back jump from B6 to B4 that I cannot display (or all the visual representation goes nuts). The edge for the back jump does not overlap with the basic blocks. In this graph, arrows follow a grid. I don't care that arrows are diagonals instead of a mix of horizontal and vertical lines but I would like to be able to see nicely the back jumps as in this graph. > > Do you have an idea on what layout/view options I could use with Roassal +Mondrian to have a better result ? > > I tried to create my own layout but after 2 hours I understood this cost too much time for my planning (or perhaps I'm just too dumb to do it fast :-( ). > > Anyway, the representation I have now is good enough for me to use it. But a better one would be better, especially for back jumps :-). > > Thanks for any help. > > Clement
-- _,.;:~^~:;._,.;:~^~:;._,.;:~^~:;._,.;:~^~:;._,.;: Alexandre Bergel http://www.bergel.eu ^~:;._,.;:~^~:;._,.;:~^~:;._,.;:~^~:;._,.;:~^~:;.
-- www.tudorgirba.com <http://www.tudorgirba.com>
"Every thing has its own flow"
-- Thierry Goubier CEA list Laboratoire des Fondations des Systèmes Temps Réel Embarqués 91191 Gif sur Yvette Cedex France Phone/Fax: +33 (0) 1 69 08 32 92 / 83 95
Hi! Sorry about the delay in my answer. I am not sure to understand. You can specify any edged to drive a layout. Simply send #userDefinedEdges: to a layout. Here an example: Circle = classes, size = number of methods; gray links = inheritance; blue links = dependencies; layout = force based layout on the inheritance links The force layout is driven by the inheritance links only. Dependencies links are not considered by the layout. -=-=-=-=-=-=-=-=-=-=-=-=-=-= | v inheritanceEdges shape | v := ROView new. shape := ROEllipse new color: (Color red alpha: 0.4); size: [ :e | e model numberOfMethods / 5 max: 5]. v addAll: (shape elementsOn: Collection withAllSubclasses). "Defining edges from inheritance" inheritanceEdges := ROEdge buildEdgesFromObjects: Collection withAllSubclasses from: #superclass to: #yourself inView: v. "Defining edges from dependencies" Collection withAllSubclasses do: [ :cls | cls methods do: [ :cm | ((cm literals select: [ :l | l class == Association and: [ l value notNil ] ]) collect: #value) do: [ :depClass | (cls ~~ depClass and: [ Collection withAllSubclasses includes: depClass ]) ifTrue: [ ROEdge buildEdgesFromAssociations: { cls -> depClass } using: (ROLine new color: (Color blue alpha: 0.1)) inView: v ] ] ] ]. "Layout the whole thing" ROForceBasedLayout new userDefinedEdges: inheritanceEdges; on: v elementsNotEdge edges: v elementsAsEdge. "Open the view" v open -=-=-=-=-=-=-=-=-=-=-=-=-=-= Cheers, Alexandre On Jan 15, 2014, at 11:32 AM, Usman Bhatti <usman.bhatti@gmail.com> wrote:
Alex,
I remember to have talked to Mathieu about the making layouts ignore some edges when drawing visualizations and I think he gave it a try as well. I think that can be helpful in Clement's case (back jumps are ignored in the layout). Do you remember to have integrated something in Roassal on these lines from Mathieu's work?
Usman
On Tue, Jan 14, 2014 at 6:20 PM, Alexandre Bergel <alexandre.bergel@me.com> wrote: Hi Clément,
Thanks for your nice words. Layouts provided by Roassal are well known generic algorithm. Creating a new layout is not complicated at all. Just subclass ROLayout and override the hook methods. Creating a layout for your need is not easy. Have you tried to google for a layout? If you find one, it should be rather easy to implement it.
Alexandre
On Jan 14, 2014, at 12:50 PM, Clément Bera <bera.clement@gmail.com> wrote:
Hello Roassal developers,
A few time ago Usman Bhatti showed me Roassal. Today I decided to use it for my daily work on a project that aims to optimize Pharo's methods.
Firstly I am quite impressed by the quality of Roassal, I am currently using the Roassal + Mondrian builder and I have a visual representation which is very close to what I want after 1 hour of work with the help of Usman. Good job guys.
Here are 2 examples of what I use:
exampleIfTrueIfFalse2 | a b | a := true. a ifTrue: [ false ifTrue: [ ^ b := 1 ] ifFalse: [ b := 2 ] ] ifFalse: [ true ifTrue: [ b := 4 ] ifFalse: [ b := 5 ] ]. ^ b
<Screen Shot 2014-01-14 at 4.14.49 PM.png>
Here there's one rectangle for each basic block, entrance/exits are basic blocks with bigger borders, and borders in red represents the "hot path", which the path the execution flow most frequently uses (based on native code counters added at some spots in the method by Cogit).
Another example:
exampleToDo
1 to: 10 do: [ :i | self kick: i ]
<Screen Shot 2014-01-14 at 4.36.47 PM.png>
Now I have a few issues with the layout. I am currently using the narrowTreeLayout which seems to be the best for my visualisation.
issue 1: When branches merges, which is in a tree when a node has 2 or more parents, or when I have a #ifTrue:ifFalse:, the child is not well aligned horizontally. Here in the first visualisation I showed, BasicBlock 5 is below but not in the middle of Basic block 8,7 and 4 (horizontally). I put a minimal width for each basic block to make it better but it's still not perfect. issue 2: (most important issue) I cannot display back jumps because then all the graph is missdrawn, therefore I need to remember where they are instead of visualizing them all the time (I cannot display the back jump from basic block 3 to basic block 2 in the second representation. In addition, the back jump edge, when well displayed, overlaps the basic blocks visualizations.
Here is an example of what I would like for the edges and basic block positions:
<Screen Shot 2014-01-14 at 4.27.32 PM.png>
As you can see, here exit is in the middle of B2 and B5 horizontally, which is not the case in my roassal visualization. In addition, there's a back jump from B6 to B4 that I cannot display (or all the visual representation goes nuts). The edge for the back jump does not overlap with the basic blocks. In this graph, arrows follow a grid. I don't care that arrows are diagonals instead of a mix of horizontal and vertical lines but I would like to be able to see nicely the back jumps as in this graph.
Do you have an idea on what layout/view options I could use with Roassal +Mondrian to have a better result ?
I tried to create my own layout but after 2 hours I understood this cost too much time for my planning (or perhaps I'm just too dumb to do it fast :-( ).
Anyway, the representation I have now is good enough for me to use it. But a better one would be better, especially for back jumps :-).
Thanks for any help.
Clement
-- _,.;:~^~:;._,.;:~^~:;._,.;:~^~:;._,.;:~^~:;._,.;: Alexandre Bergel http://www.bergel.eu ^~:;._,.;:~^~:;._,.;:~^~:;._,.;:~^~:;._,.;:~^~:;.
-- _,.;:~^~:;._,.;:~^~:;._,.;:~^~:;._,.;:~^~:;._,.;: Alexandre Bergel http://www.bergel.eu ^~:;._,.;:~^~:;._,.;:~^~:;._,.;:~^~:;._,.;:~^~:;.
Oups, you need to remove "edges: v elementsAsEdgeâ in the script. Similar code using Roassal2, with bezier curves Cheers, Alexandre On Jan 26, 2014, at 11:17 PM, Alexandre Bergel <alexandre.bergel@me.com> wrote:
Hi!
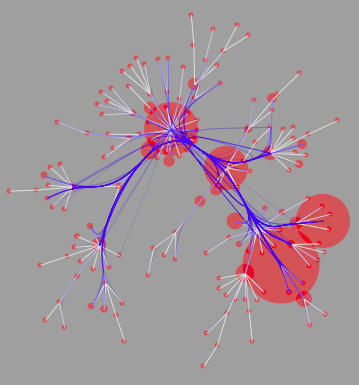
Sorry about the delay in my answer. I am not sure to understand. You can specify any edged to drive a layout. Simply send #userDefinedEdges: to a layout. Here an example: <Screen Shot 2014-01-26 at 11.15.41 PM.png>
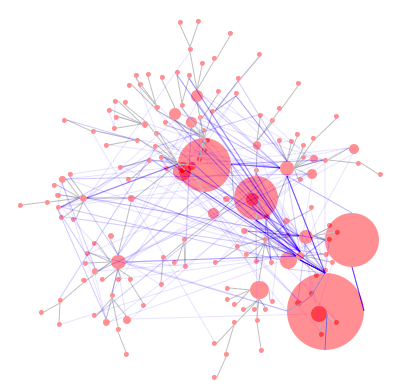
Circle = classes, size = number of methods; gray links = inheritance; blue links = dependencies; layout = force based layout on the inheritance links
The force layout is driven by the inheritance links only. Dependencies links are not considered by the layout. -=-=-=-=-=-=-=-=-=-=-=-=-=-= | v inheritanceEdges shape | v := ROView new. shape := ROEllipse new color: (Color red alpha: 0.4); size: [ :e | e model numberOfMethods / 5 max: 5]. v addAll: (shape elementsOn: Collection withAllSubclasses).
"Defining edges from inheritance" inheritanceEdges := ROEdge buildEdgesFromObjects: Collection withAllSubclasses from: #superclass to: #yourself inView: v.
"Defining edges from dependencies" Collection withAllSubclasses do: [ :cls | cls methods do: [ :cm | ((cm literals select: [ :l | l class == Association and: [ l value notNil ] ]) collect: #value) do: [ :depClass | (cls ~~ depClass and: [ Collection withAllSubclasses includes: depClass ]) ifTrue: [
ROEdge buildEdgesFromAssociations: { cls -> depClass } using: (ROLine new color: (Color blue alpha: 0.1)) inView: v ] ] ] ].
"Layout the whole thing" ROForceBasedLayout new userDefinedEdges: inheritanceEdges; on: v elementsNotEdge edges: v elementsAsEdge.
"Open the view" v open -=-=-=-=-=-=-=-=-=-=-=-=-=-=
Cheers, Alexandre
On Jan 15, 2014, at 11:32 AM, Usman Bhatti <usman.bhatti@gmail.com> wrote:
Alex,
I remember to have talked to Mathieu about the making layouts ignore some edges when drawing visualizations and I think he gave it a try as well. I think that can be helpful in Clement's case (back jumps are ignored in the layout). Do you remember to have integrated something in Roassal on these lines from Mathieu's work?
Usman
On Tue, Jan 14, 2014 at 6:20 PM, Alexandre Bergel <alexandre.bergel@me.com> wrote: Hi Clément,
Thanks for your nice words. Layouts provided by Roassal are well known generic algorithm. Creating a new layout is not complicated at all. Just subclass ROLayout and override the hook methods. Creating a layout for your need is not easy. Have you tried to google for a layout? If you find one, it should be rather easy to implement it.
Alexandre
On Jan 14, 2014, at 12:50 PM, Clément Bera <bera.clement@gmail.com> wrote:
Hello Roassal developers,
A few time ago Usman Bhatti showed me Roassal. Today I decided to use it for my daily work on a project that aims to optimize Pharo's methods.
Firstly I am quite impressed by the quality of Roassal, I am currently using the Roassal + Mondrian builder and I have a visual representation which is very close to what I want after 1 hour of work with the help of Usman. Good job guys.
Here are 2 examples of what I use:
exampleIfTrueIfFalse2 | a b | a := true. a ifTrue: [ false ifTrue: [ ^ b := 1 ] ifFalse: [ b := 2 ] ] ifFalse: [ true ifTrue: [ b := 4 ] ifFalse: [ b := 5 ] ]. ^ b
<Screen Shot 2014-01-14 at 4.14.49 PM.png>
Here there's one rectangle for each basic block, entrance/exits are basic blocks with bigger borders, and borders in red represents the "hot path", which the path the execution flow most frequently uses (based on native code counters added at some spots in the method by Cogit).
Another example:
exampleToDo
1 to: 10 do: [ :i | self kick: i ]
<Screen Shot 2014-01-14 at 4.36.47 PM.png>
Now I have a few issues with the layout. I am currently using the narrowTreeLayout which seems to be the best for my visualisation.
issue 1: When branches merges, which is in a tree when a node has 2 or more parents, or when I have a #ifTrue:ifFalse:, the child is not well aligned horizontally. Here in the first visualisation I showed, BasicBlock 5 is below but not in the middle of Basic block 8,7 and 4 (horizontally). I put a minimal width for each basic block to make it better but it's still not perfect. issue 2: (most important issue) I cannot display back jumps because then all the graph is missdrawn, therefore I need to remember where they are instead of visualizing them all the time (I cannot display the back jump from basic block 3 to basic block 2 in the second representation. In addition, the back jump edge, when well displayed, overlaps the basic blocks visualizations.
Here is an example of what I would like for the edges and basic block positions:
<Screen Shot 2014-01-14 at 4.27.32 PM.png>
As you can see, here exit is in the middle of B2 and B5 horizontally, which is not the case in my roassal visualization. In addition, there's a back jump from B6 to B4 that I cannot display (or all the visual representation goes nuts). The edge for the back jump does not overlap with the basic blocks. In this graph, arrows follow a grid. I don't care that arrows are diagonals instead of a mix of horizontal and vertical lines but I would like to be able to see nicely the back jumps as in this graph.
Do you have an idea on what layout/view options I could use with Roassal +Mondrian to have a better result ?
I tried to create my own layout but after 2 hours I understood this cost too much time for my planning (or perhaps I'm just too dumb to do it fast :-( ).
Anyway, the representation I have now is good enough for me to use it. But a better one would be better, especially for back jumps :-).
Thanks for any help.
Clement
-- _,.;:~^~:;._,.;:~^~:;._,.;:~^~:;._,.;:~^~:;._,.;: Alexandre Bergel http://www.bergel.eu ^~:;._,.;:~^~:;._,.;:~^~:;._,.;:~^~:;._,.;:~^~:;.
-- _,.;:~^~:;._,.;:~^~:;._,.;:~^~:;._,.;:~^~:;._,.;: Alexandre Bergel http://www.bergel.eu ^~:;._,.;:~^~:;._,.;:~^~:;._,.;:~^~:;._,.;:~^~:;.
-- _,.;:~^~:;._,.;:~^~:;._,.;:~^~:;._,.;:~^~:;._,.;: Alexandre Bergel http://www.bergel.eu ^~:;._,.;:~^~:;._,.;:~^~:;._,.;:~^~:;._,.;:~^~:;.
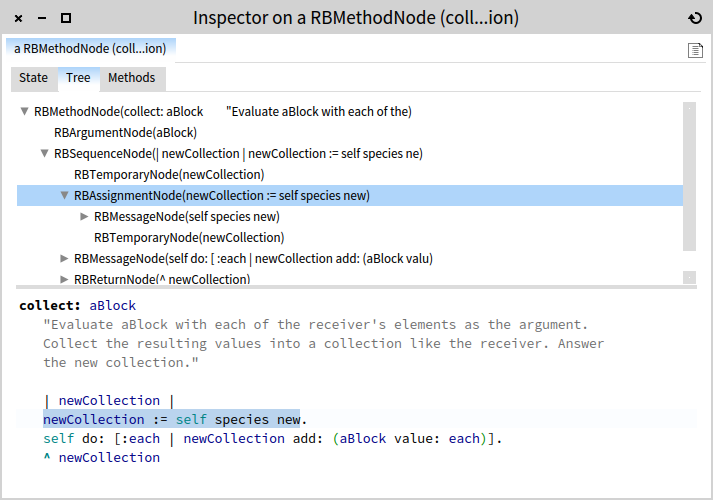
Hi Clement, Pretty exciting. As Alex says, your desired algorithm is pretty specific, but it looks similar to a UML layout. If you could find one that would fit your needs, it would be a valuable addition to point us to it. Perhaps we can find the resources to implement it. Now, about your workflow. Roassal alone can already provide value added on top of existing default tools, and it's great that you could show what you could do in one hour. It takes a bit of leap of faith, but then you do not want to go back :). But, I think you would benefit even more by taking a look at the GTInspector and other related tools. For example, here are a couple of posts that might be of interest (they talk precisely about code analysis in Pharo): http://www.humane-assessment.com/blog/guiding-custom-changes-with-gtinspecto... http://www.humane-assessment.com/blog/a-pharo-refactoring-story-adding-theme... I would actually be interested in helping you build tools that would match your case. The reason is that in order to show the value of these tools we need custom problems - and you happen to have identified some. Could you describe the needs you have in more details? As far as I can see, the visualization is derived from source code. This can be seen as being similar to how an AST is derived from source code. The GTInspector already provides an implementation of understanding this mapping. For example, in an image with GTInspector (just download the Moose one for quick tests) do: (Collection>>#collect:) parseTree inspect and you get a picture like the attached one. [image: Inline image 1] If you give me more concrete things to look at, I can try to help. Cheers, Doru On Tue, Jan 14, 2014 at 4:50 PM, Clément Bera <bera.clement@gmail.com>wrote:
Hello Roassal developers,
A few time ago Usman Bhatti showed me Roassal. Today I decided to use it for my daily work on a project that aims to optimize Pharo's methods.
Firstly I am quite impressed by the quality of Roassal, I am currently using the Roassal + Mondrian builder and I have a visual representation which is very close to what I want after 1 hour of work with the help of Usman. Good job guys.
Here are 2 examples of what I use:
exampleIfTrueIfFalse2 | a b | a := true. a ifTrue: [ false ifTrue: [ ^ b := 1 ] ifFalse: [ b := 2 ] ] ifFalse: [ true ifTrue: [ b := 4 ] ifFalse: [ b := 5 ] ]. ^ b
[image: Images intégrées 1]
Here there's one rectangle for each basic block, entrance/exits are basic blocks with bigger borders, and borders in red represents the "hot path", which the path the execution flow most frequently uses (based on native code counters added at some spots in the method by Cogit).
Another example:
exampleToDo 1 to: 10 do: [ :i | self kick: i ]
[image: Images intégrées 3]
Now I have a few issues with the layout. I am currently using the narrowTreeLayout which seems to be the best for my visualisation.
*issue 1:* When branches merges, which is in a tree when a node has 2 or more parents, or when I have a #ifTrue:ifFalse:, the child is not well aligned horizontally. Here in the first visualisation I showed, BasicBlock 5 is below but not in the middle of Basic block 8,7 and 4 (horizontally). I put a minimal width for each basic block to make it better but it's still not perfect. *issue 2:* (most important issue) I cannot display back jumps because then all the graph is missdrawn, therefore I need to remember where they are instead of visualizing them all the time (I cannot display the back jump from basic block 3 to basic block 2 in the second representation. In addition, the back jump edge, when well displayed, overlaps the basic blocks visualizations.
Here is an example of what I would like for the edges and basic block positions:
[image: Images intégrées 2]
As you can see, here exit is in the middle of B2 and B5 horizontally, which is not the case in my roassal visualization. In addition, there's a back jump from B6 to B4 that I cannot display (or all the visual representation goes nuts). The edge for the back jump does not overlap with the basic blocks. In this graph, arrows follow a grid. I don't care that arrows are diagonals instead of a mix of horizontal and vertical lines but I would like to be able to see nicely the back jumps as in this graph.
Do you have an idea on what layout/view options I could use with Roassal +Mondrian to have a better result ?
I tried to create my own layout but after 2 hours I understood this cost too much time for my planning (or perhaps I'm just too dumb to do it fast :-( ).
Anyway, the representation I have now is good enough for me to use it. But a better one would be better, especially for back jumps :-).
Thanks for any help.
Clement
-- www.tudorgirba.com "Every thing has its own flow"

On 14 Jan 2014, at 22:06, Tudor Girba <tudor@tudorgirba.com> wrote:
As far as I can see, the visualization is derived from source code. This can be seen as being similar to how an AST is derived from source code. The GTInspector already provides an implementation of understanding this mapping. For example, in an image with GTInspector (just download the Moose one for quick tests) do: (Collection>>#collect:) parseTree inspect
and you get a picture like the attached one. <Inspector on a RBMethodNode (coll...ion).png>
This is *very* impressive⦠:-) Marcus
Hello, I looked in the literature and there are a few paper about exactly the visualization I want. Examples: a paper about Graph Layout for Code Flow Visualization http://citeseerx.ist.psu.edu/viewdoc/download?doi=10.1.1.112.3748&rep=rep1&t... a bachelor thesis on java control flow graph visualization for compiler optimization http://ssw.jku.at/General/Staff/TW/Wuerthinger06Bachelor.pdf Perhaps at some point if we find a bachelor to hire in our team we could ask him to implement such a visualization too (as they did for java seemingly). But I looked at java's control flow graph I saw they would not increase much my productivity compared to what I have now, back jumps are displayed but not in a so good way. Therefore I'll use what I have now. However it would be nice to have that to teach easily compiler optimizations to people. Doru, I *really* need dedicated tools but I have already built them myself. A year ago, I didn't know about GTInspector and Moldable debugger, so I built dedicated inspectors with the old inspector framework of Pharo, then as it was not good enough I built new inspectors based on Spec, and I ported the generic classes of these inspectors in Pharo 3. Specific subclasses of these inspectors exist for my projects. For example, here's an inspector of an object in memory (an object oriented pointer): [image: Images intégrées 1] With on the left the current address in memory, then what field it is for the object (which is the class MethodDictionary), then the address written at this memory location, and the result of #printString sent to this new address. The next tool I'm going to built is a read only debugger (I mean without on the fly method edition) to step on x86 disassembled instructions and its abstract representation (similar to R*egister Transfer Language <http://fr.wikipedia.org/wiki/Register_Transfer_Language>)* I used in my compilation chain. I discussed once with Andrei and it seems the moldable debugger fits more in the case where you need to debug smalltalk code or at least byte code dependent code. In my case I compile from AST to x86 skipping the byte code so as far as I know it is quite hard to build a tool with what you have. In addition, I'd like to plug the Spec inspectors I built before, which may not be easy if I choose to build the additional tools in Glamour. So the timing is not very good for tools in my projects. Thanks for offering your help anyway. However the tool you showed on RB AST is really cool, especially that I use all the time intermediate representations that could perfectly fit this kind of inspectors (mostly graphs). But I prefer visualization like the one of roassal. Regards 2014/1/15 Marcus Denker <marcus.denker@inria.fr>
On 14 Jan 2014, at 22:06, Tudor Girba <tudor@tudorgirba.com> wrote:
As far as I can see, the visualization is derived from source code. This
can be seen as being similar to how an AST is derived from source code. The GTInspector already provides an implementation of understanding this mapping. For example, in an image with GTInspector (just download the Moose one for quick tests) do:
(Collection>>#collect:) parseTree inspect
and you get a picture like the attached one. <Inspector on a RBMethodNode (coll...ion).png>
This is *very* impressive⦠:-)
Marcus
Hi Clement, I am happy you see value in these specific tools and that you built your own. I strongly believe there is great potential for Pharo in showing how development can change dramatically when these custom tools become cheap, and I would want to collect examples that provide incentives for others to do the same. So now, I am even more interested in taking a look :) Could you point me to: - the way to setup the image (ideally with scripts starting from a Pharo 3.0 image) - the Spec tools and Roassal visualizations you built - some instances of how to trigger the inspectors and visualizations ? Cheers, Doru On Wed, Jan 15, 2014 at 9:45 AM, Clément Bera <bera.clement@gmail.com>wrote:
Hello,
I looked in the literature and there are a few paper about exactly the visualization I want. Examples: a paper about Graph Layout for Code Flow Visualization
http://citeseerx.ist.psu.edu/viewdoc/download?doi=10.1.1.112.3748&rep=rep1&t... a bachelor thesis on java control flow graph visualization for compiler optimization http://ssw.jku.at/General/Staff/TW/Wuerthinger06Bachelor.pdf
Perhaps at some point if we find a bachelor to hire in our team we could ask him to implement such a visualization too (as they did for java seemingly).
But I looked at java's control flow graph I saw they would not increase much my productivity compared to what I have now, back jumps are displayed but not in a so good way. Therefore I'll use what I have now. However it would be nice to have that to teach easily compiler optimizations to people.
Doru,
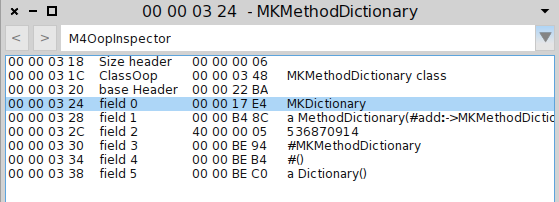
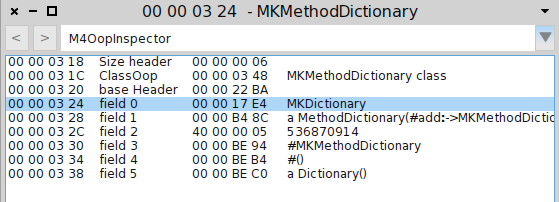
I *really* need dedicated tools but I have already built them myself. A year ago, I didn't know about GTInspector and Moldable debugger, so I built dedicated inspectors with the old inspector framework of Pharo, then as it was not good enough I built new inspectors based on Spec, and I ported the generic classes of these inspectors in Pharo 3. Specific subclasses of these inspectors exist for my projects. For example, here's an inspector of an object in memory (an object oriented pointer):
[image: Images intégrées 1]
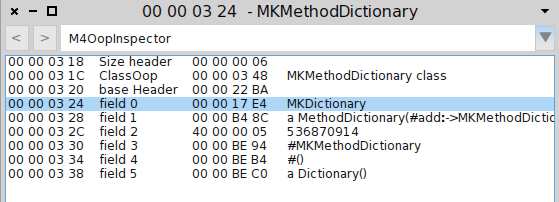
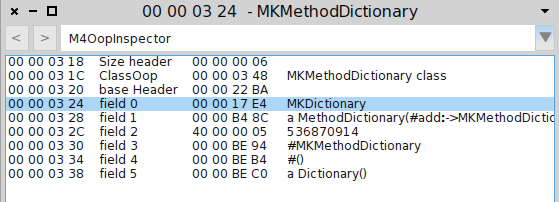
With on the left the current address in memory, then what field it is for the object (which is the class MethodDictionary), then the address written at this memory location, and the result of #printString sent to this new address.
The next tool I'm going to built is a read only debugger (I mean without on the fly method edition) to step on x86 disassembled instructions and its abstract representation (similar to R*egister Transfer Language <http://fr.wikipedia.org/wiki/Register_Transfer_Language>)* I used in my compilation chain. I discussed once with Andrei and it seems the moldable debugger fits more in the case where you need to debug smalltalk code or at least byte code dependent code. In my case I compile from AST to x86 skipping the byte code so as far as I know it is quite hard to build a tool with what you have. In addition, I'd like to plug the Spec inspectors I built before, which may not be easy if I choose to build the additional tools in Glamour. So the timing is not very good for tools in my projects.
Thanks for offering your help anyway.
However the tool you showed on RB AST is really cool, especially that I use all the time intermediate representations that could perfectly fit this kind of inspectors (mostly graphs). But I prefer visualization like the one of roassal.
Regards
2014/1/15 Marcus Denker <marcus.denker@inria.fr>
On 14 Jan 2014, at 22:06, Tudor Girba <tudor@tudorgirba.com> wrote:
As far as I can see, the visualization is derived from source code.
This can be seen as being similar to how an AST is derived from source code. The GTInspector already provides an implementation of understanding this mapping. For example, in an image with GTInspector (just download the Moose one for quick tests) do:
(Collection>>#collect:) parseTree inspect
and you get a picture like the attached one. <Inspector on a RBMethodNode (coll...ion).png>
This is *very* impressive⦠:-)
Marcus
-- www.tudorgirba.com "Every thing has its own flow"
Hi Doru, I agree that custom tools are valuables. I don't know anyone working in VMs that does not have his own tools. Have you ever looked at the StackVM / CogVM Simulator ? They're cool and similar to what I am doing for my research project. I believe Eliot showed it in some presentation. And see how the java Maxine VM guys sold their inspector tool suite. For the roassal visualization, take the image there: https://ci.inria.fr/rmod/view/Mate/job/Sista/ and execute: (Morph>>#invalidRect:from:) liliCFG convertToSSA roassalVisualisation This should work on any method. The alternative, the text visualization that I used before, is: (Morph>>#invalidRect:from:) liliCFG convertToSSA printString. As you can see in complex control flow the roassal visualization is way better. For the 3 other tools I did/am doing the problem is that the other project is not stable currently. It will be stable again in several months. I have one half- stable image for demo, but even there only the Memory inspector works (the stack inspector is not stable). It requires to bootstrap an image in a byte array, the bootstrapped image being in a different object's format. So I guess I could show you some tools this summer (or this autumn) if you are really interested but not now. Basically there's an inspector for the objects in memory, for the stack, and some kind of cpu instructions debugger. Note that the problem is not in writing tools itself but in building a running system where I could apply the tools. Another interesting tool suite is the one from spoon: 3D visu: http://www.youtube.com/watch?v=FQgMlpQpu7w 2D visu: http://www.youtube.com/watch?v=1Uh8v7IzXJk The first tool would be cool as an alternative to the pointer explorer to detect memory leaks. Cheers, 2014/1/16 Tudor Girba <tudor@tudorgirba.com>
Hi Clement,
I am happy you see value in these specific tools and that you built your own. I strongly believe there is great potential for Pharo in showing how development can change dramatically when these custom tools become cheap, and I would want to collect examples that provide incentives for others to do the same. So now, I am even more interested in taking a look :)
Could you point me to: - the way to setup the image (ideally with scripts starting from a Pharo 3.0 image) - the Spec tools and Roassal visualizations you built - some instances of how to trigger the inspectors and visualizations
?
Cheers, Doru
On Wed, Jan 15, 2014 at 9:45 AM, Clément Bera <bera.clement@gmail.com>wrote:
Hello,
I looked in the literature and there are a few paper about exactly the visualization I want. Examples: a paper about Graph Layout for Code Flow Visualization
http://citeseerx.ist.psu.edu/viewdoc/download?doi=10.1.1.112.3748&rep=rep1&t... a bachelor thesis on java control flow graph visualization for compiler optimization http://ssw.jku.at/General/Staff/TW/Wuerthinger06Bachelor.pdf
Perhaps at some point if we find a bachelor to hire in our team we could ask him to implement such a visualization too (as they did for java seemingly).
But I looked at java's control flow graph I saw they would not increase much my productivity compared to what I have now, back jumps are displayed but not in a so good way. Therefore I'll use what I have now. However it would be nice to have that to teach easily compiler optimizations to people.
Doru,
I *really* need dedicated tools but I have already built them myself. A year ago, I didn't know about GTInspector and Moldable debugger, so I built dedicated inspectors with the old inspector framework of Pharo, then as it was not good enough I built new inspectors based on Spec, and I ported the generic classes of these inspectors in Pharo 3. Specific subclasses of these inspectors exist for my projects. For example, here's an inspector of an object in memory (an object oriented pointer):
[image: Images intégrées 1]
With on the left the current address in memory, then what field it is for the object (which is the class MethodDictionary), then the address written at this memory location, and the result of #printString sent to this new address.
The next tool I'm going to built is a read only debugger (I mean without on the fly method edition) to step on x86 disassembled instructions and its abstract representation (similar to R*egister Transfer Language <http://fr.wikipedia.org/wiki/Register_Transfer_Language>)* I used in my compilation chain. I discussed once with Andrei and it seems the moldable debugger fits more in the case where you need to debug smalltalk code or at least byte code dependent code. In my case I compile from AST to x86 skipping the byte code so as far as I know it is quite hard to build a tool with what you have. In addition, I'd like to plug the Spec inspectors I built before, which may not be easy if I choose to build the additional tools in Glamour. So the timing is not very good for tools in my projects.
Thanks for offering your help anyway.
However the tool you showed on RB AST is really cool, especially that I use all the time intermediate representations that could perfectly fit this kind of inspectors (mostly graphs). But I prefer visualization like the one of roassal.
Regards
2014/1/15 Marcus Denker <marcus.denker@inria.fr>
On 14 Jan 2014, at 22:06, Tudor Girba <tudor@tudorgirba.com> wrote:
As far as I can see, the visualization is derived from source code.
This can be seen as being similar to how an AST is derived from source code. The GTInspector already provides an implementation of understanding this mapping. For example, in an image with GTInspector (just download the Moose one for quick tests) do:
(Collection>>#collect:) parseTree inspect
and you get a picture like the attached one. <Inspector on a RBMethodNode (coll...ion).png>
This is *very* impressive⦠:-)
Marcus
-- www.tudorgirba.com
"Every thing has its own flow"
Hi Clément, I just tried to reproduce the visualization, but it is not available in the Sista image. I also tried to load LiliVisualization, but it does not seem to be working either. Could you point me to a full image? Anyway, I saw the printString you have, but I could not find any of the custom inspectors your were mentioning. Could you point me to where I can find them? As for the visualizations, indeed I saw them before. But, my problem is that I do not know what problems they are trying to solve (besides the graph looking nice - which can be a goal in itself). Could you elaborate on this? Perhaps we can find alternative solutions. Cheers, Doru On Thu, Jan 16, 2014 at 4:03 PM, Clément Bera <bera.clement@gmail.com>wrote:
Hi Doru,
I agree that custom tools are valuables. I don't know anyone working in VMs that does not have his own tools. Have you ever looked at the StackVM / CogVM Simulator ? They're cool and similar to what I am doing for my research project. I believe Eliot showed it in some presentation. And see how the java Maxine VM guys sold their inspector tool suite.
For the roassal visualization, take the image there: https://ci.inria.fr/rmod/view/Mate/job/Sista/ and execute: (Morph>>#invalidRect:from:) liliCFG convertToSSA roassalVisualisation This should work on any method. The alternative, the text visualization that I used before, is: (Morph>>#invalidRect:from:) liliCFG convertToSSA printString. As you can see in complex control flow the roassal visualization is way better.
For the 3 other tools I did/am doing the problem is that the other project is not stable currently. It will be stable again in several months. I have one half- stable image for demo, but even there only the Memory inspector works (the stack inspector is not stable). It requires to bootstrap an image in a byte array, the bootstrapped image being in a different object's format. So I guess I could show you some tools this summer (or this autumn) if you are really interested but not now. Basically there's an inspector for the objects in memory, for the stack, and some kind of cpu instructions debugger. Note that the problem is not in writing tools itself but in building a running system where I could apply the tools.
Another interesting tool suite is the one from spoon: 3D visu: http://www.youtube.com/watch?v=FQgMlpQpu7w 2D visu: http://www.youtube.com/watch?v=1Uh8v7IzXJk The first tool would be cool as an alternative to the pointer explorer to detect memory leaks.
Cheers,
2014/1/16 Tudor Girba <tudor@tudorgirba.com>
Hi Clement,
I am happy you see value in these specific tools and that you built your own. I strongly believe there is great potential for Pharo in showing how development can change dramatically when these custom tools become cheap, and I would want to collect examples that provide incentives for others to do the same. So now, I am even more interested in taking a look :)
Could you point me to: - the way to setup the image (ideally with scripts starting from a Pharo 3.0 image) - the Spec tools and Roassal visualizations you built - some instances of how to trigger the inspectors and visualizations
?
Cheers, Doru
On Wed, Jan 15, 2014 at 9:45 AM, Clément Bera <bera.clement@gmail.com>wrote:
Hello,
I looked in the literature and there are a few paper about exactly the visualization I want. Examples: a paper about Graph Layout for Code Flow Visualization
http://citeseerx.ist.psu.edu/viewdoc/download?doi=10.1.1.112.3748&rep=rep1&t... a bachelor thesis on java control flow graph visualization for compiler optimization http://ssw.jku.at/General/Staff/TW/Wuerthinger06Bachelor.pdf
Perhaps at some point if we find a bachelor to hire in our team we could ask him to implement such a visualization too (as they did for java seemingly).
But I looked at java's control flow graph I saw they would not increase much my productivity compared to what I have now, back jumps are displayed but not in a so good way. Therefore I'll use what I have now. However it would be nice to have that to teach easily compiler optimizations to people.
Doru,
I *really* need dedicated tools but I have already built them myself. A year ago, I didn't know about GTInspector and Moldable debugger, so I built dedicated inspectors with the old inspector framework of Pharo, then as it was not good enough I built new inspectors based on Spec, and I ported the generic classes of these inspectors in Pharo 3. Specific subclasses of these inspectors exist for my projects. For example, here's an inspector of an object in memory (an object oriented pointer):
[image: Images intégrées 1]
With on the left the current address in memory, then what field it is for the object (which is the class MethodDictionary), then the address written at this memory location, and the result of #printString sent to this new address.
The next tool I'm going to built is a read only debugger (I mean without on the fly method edition) to step on x86 disassembled instructions and its abstract representation (similar to R*egister Transfer Language <http://fr.wikipedia.org/wiki/Register_Transfer_Language>)* I used in my compilation chain. I discussed once with Andrei and it seems the moldable debugger fits more in the case where you need to debug smalltalk code or at least byte code dependent code. In my case I compile from AST to x86 skipping the byte code so as far as I know it is quite hard to build a tool with what you have. In addition, I'd like to plug the Spec inspectors I built before, which may not be easy if I choose to build the additional tools in Glamour. So the timing is not very good for tools in my projects.
Thanks for offering your help anyway.
However the tool you showed on RB AST is really cool, especially that I use all the time intermediate representations that could perfectly fit this kind of inspectors (mostly graphs). But I prefer visualization like the one of roassal.
Regards
2014/1/15 Marcus Denker <marcus.denker@inria.fr>
On 14 Jan 2014, at 22:06, Tudor Girba <tudor@tudorgirba.com> wrote:
As far as I can see, the visualization is derived from source code.
This can be seen as being similar to how an AST is derived from source code. The GTInspector already provides an implementation of understanding this mapping. For example, in an image with GTInspector (just download the Moose one for quick tests) do:
(Collection>>#collect:) parseTree inspect
and you get a picture like the attached one. <Inspector on a RBMethodNode (coll...ion).png>
This is *very* impressive⦠:-)
Marcus
-- www.tudorgirba.com
"Every thing has its own flow"
-- www.tudorgirba.com "Every thing has its own flow"
On 26 Jan 2014, at 14:45, Tudor Girba <tudor@tudorgirba.com> wrote:
As for the visualizations, indeed I saw them before. But, my problem is that I do not know what problems they are trying to solve (besides the graph looking nice - which can be a goal in itself). Could you elaborate on this? Perhaps we can find alternative solutions.
Try to find a bug in the text representation as opposed to the graphical oneâ¦. the text one just does not work as you can not follow control flow. Marcus
Hi Clement, for something like that, try the Sugiyama Layout in Roassal. This is the layout we usually use when we have to display control flow graphs over code with Dot. Thierry Le 14/01/2014 16:50, Clément Bera a écrit :
Hello Roassal developers,
A few time ago Usman Bhatti showed me Roassal. Today I decided to use it for my daily work on a project that aims to optimize Pharo's methods.
Firstly I am quite impressed by the quality of Roassal, I am currently using the Roassal + Mondrian builder and I have a visual representation which is very close to what I want after 1 hour of work with the help of Usman. Good job guys.
Here are 2 examples of what I use:
exampleIfTrueIfFalse2 | a b | a := true. a ifTrue: [ false ifTrue: [ ^ b := 1 ] ifFalse: [ b := 2 ] ] ifFalse: [ true ifTrue: [ b := 4 ] ifFalse: [ b := 5 ] ]. ^ b
Images intégrées 1
Here there's one rectangle for each basic block, entrance/exits are basic blocks with bigger borders, and borders in red represents the "hot path", which the path the execution flow most frequently uses (based on native code counters added at some spots in the method by Cogit).
Another example:
exampleToDo 1 to: 10 do: [ :i | self kick: i ]
Images intégrées 3
Now I have a few issues with the layout. I am currently using the narrowTreeLayout which seems to be the best for my visualisation.
*issue 1:* When branches merges, which is in a tree when a node has 2 or more parents, or when I have a #ifTrue:ifFalse:, the child is not well aligned horizontally. Here in the first visualisation I showed, BasicBlock 5 is below but not in the middle of Basic block 8,7 and 4 (horizontally). I put a minimal width for each basic block to make it better but it's still not perfect. *issue 2:* (most important issue) I cannot display back jumps because then all the graph is missdrawn, therefore I need to remember where they are instead of visualizing them all the time (I cannot display the back jump from basic block 3 to basic block 2 in the second representation. In addition, the back jump edge, when well displayed, overlaps the basic blocks visualizations.
Here is an example of what I would like for the edges and basic block positions:
Images intégrées 2
As you can see, here exit is in the middle of B2 and B5 horizontally, which is not the case in my roassal visualization. In addition, there's a back jump from B6 to B4 that I cannot display (or all the visual representation goes nuts). The edge for the back jump does not overlap with the basic blocks. In this graph, arrows follow a grid. I don't care that arrows are diagonals instead of a mix of horizontal and vertical lines but I would like to be able to see nicely the back jumps as in this graph.
Do you have an idea on what layout/view options I could use with Roassal +Mondrian to have a better result ?
I tried to create my own layout but after 2 hours I understood this cost too much time for my planning (or perhaps I'm just too dumb to do it fast :-( ).
Anyway, the representation I have now is good enough for me to use it. But a better one would be better, especially for back jumps :-).
Thanks for any help.
Clement
-- Thierry Goubier CEA list Laboratoire des Fondations des Systèmes Temps Réel Embarqués 91191 Gif sur Yvette Cedex France Phone/Fax: +33 (0) 1 69 08 32 92 / 83 95
participants (6)
-
 Alexandre Bergel
 -
 Clément Bera
 -
 Goubier Thierry
 -
 Marcus Denker
 -
 Tudor Girba
 -
 Usman Bhatti