Weird ZnClient benchmarking result

Hi, While benchmarking ZnClient I encountered something weird and counter intuitive that I cannot explain. This was on macOS running Pharo 7 and 6. First you need to setup a fast local HTTP server, can be anything, for example: $ brew install nginx $ brew services start nginx $ curl http://localhost:8080 In Pharo, the benchmark code looks as follows: ZnClient new in: [ :client | [ client get: 'http://localhost:8080' ] bench ]. On my machine this gives about 2500 req/s. ZnClient uses object logging: it emits special event objects that contain information regarding what happens (full details and timing information) using an Announcer. Subscribers can then decide what to do with this detailed information. This mechanism is always active, but there is an option to turn it totally off for maximum performance: ZnClient new in: [ :client | client loggingOff. [ client get: 'http://localhost:8080' ] bench ]. This gives about 3000 req/s, a non-trivial + 500 req/s improvement. Now comes the weird thing. GT contains a custom view for Announcers, inspect: ZnLogEvent announcer. And select the Announcements tab. Leave this window open. Now, the first expression (with full logging enabled and an active subscriber with a UI) is way FASTER than first, it yields about 7000 to 8000 req/s. Since the benchmark runs in the main UI thread, no actual drawing happens until the expression finishes. Running both expression inside a Time profiler show how in the first case significant time (actually *most* time ;-) is spent in the logging: In the second case, with logging disabled, that changes to: One has to take into account that the request has to be processed by the server, so from the client's perspective, most time will always be spent waiting for a reply, #readResponse. With the logging enabled, probably less time is spent waiting, since the client does a bit more work. Still what should be slower is more than 2 times as fast ! I have a feeling that this has to do with scheduling (probably interacting with network IO), as going deep into the last #readResponse above, I see: But I still cannot understand why doing apparently more work results in faster throughput. Can anyone explain this behaviour ? Thx, Sven

On 11 December 2017 at 00:14, Sven Van Caekenberghe <sven@stfx.eu> wrote:
Hi,
While benchmarking ZnClient I encountered something weird and counter intuitive that I cannot explain.
This was on macOS running Pharo 7 and 6.
First you need to setup a fast local HTTP server, can be anything, for example:
$ brew install nginx $ brew services start nginx $ curl http://localhost:8080
In Pharo, the benchmark code looks as follows:
ZnClient new in: [ :client | [ client get: 'http://localhost:8080' ] bench ].
On my machine this gives about 2500 req/s.
ZnClient uses object logging: it emits special event objects that contain information regarding what happens (full details and timing information) using an Announcer. Subscribers can then decide what to do with this detailed information. This mechanism is always active, but there is an option to turn it totally off for maximum performance:
ZnClient new in: [ :client | client loggingOff. [ client get: 'http://localhost:8080' ] bench ].
This gives about 3000 req/s, a non-trivial + 500 req/s improvement.
Now comes the weird thing. GT contains a custom view for Announcers, inspect:
ZnLogEvent announcer.
And select the Announcements tab. Leave this window open.
Now, the first expression (with full logging enabled and an active subscriber with a UI) is way FASTER than first, it yields about 7000 to 8000 req/s. Since the benchmark runs in the main UI thread, no actual drawing happens until the expression finishes.
Can you compare logging from Nginx to confirm the additional requests. Perhaps in the second case each Annoucement is being re-Announced. cheers -ben
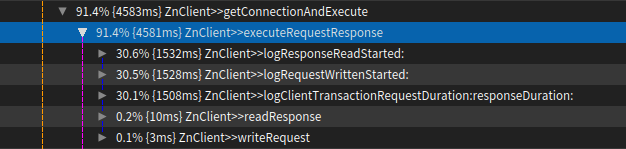
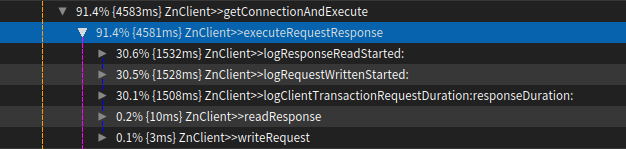
Running both expression inside a Time profiler show how in the first case significant time (actually *most* time ;-) is spent in the logging:
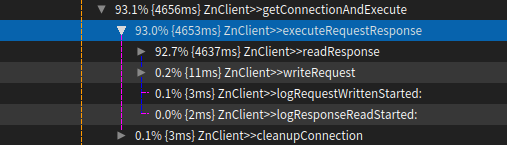
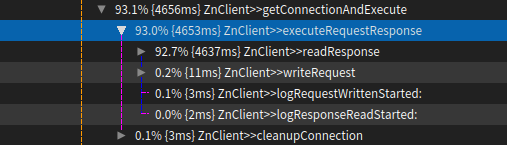
In the second case, with logging disabled, that changes to:
One has to take into account that the request has to be processed by the server, so from the client's perspective, most time will always be spent waiting for a reply, #readResponse. With the logging enabled, probably less time is spent waiting, since the client does a bit more work. Still what should be slower is more than 2 times as fast !
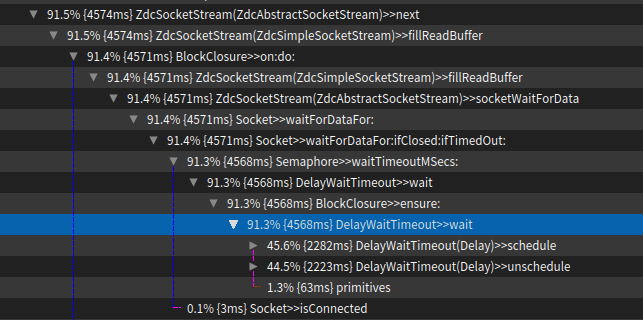
I have a feeling that this has to do with scheduling (probably interacting with network IO), as going deep into the last #readResponse above, I see:
But I still cannot understand why doing apparently more work results in faster throughput.
Can anyone explain this behaviour ?
Thx,
Sven

Hi Sven, What you are seeing is most likely a $, vs $. issue. See BenchmarkResult >>#printFrequenceOn: it uses both decimal and thousand separators. If i run this code: ----------------------------------------- | counter | counter := ZnClient new in: [ :client | client loggingOff. [ client get: 'http://localhost:8080'. counter ] bench ]. counter. ----------------------------------------- Then i get 9035 ('1,773 per second') when no inspector is open, and only 22 ('5.995 per second') when inspecting the logs. Best regards, Henrik -- Sent from: http://forum.world.st/Pharo-Smalltalk-Developers-f1294837.html
@ Henrik Arg, arg, arg, yes of course. I actually did think about that, but still did not look carefully enough !! Really stupid of me. It is even worse because I wrote that code ... Now, the #printOn: of BenchmarkResult is much clearer, less confusing: ZnClient new in: [ :client | [ client get: 'http://localhost:8080' ] benchFor: 5 seconds ]. a BenchmarkResult(14,732 iterations in 5 seconds. 2,946 per second) vs ZnClient new in: [ :client | client loggingOff. [ client get: 'http://localhost:8080' ] benchFor: 5 seconds ]. a BenchmarkResult(42 iterations in 5 seconds 88 milliseconds. 8.255 per second) Still the same issue with $, and $. in frequency, but the iteration count is crystal clear. The reason #bench works like that is backwards compatibility at the time we introduced that. @ Ben Yes, I should have looked at the other side as well, to confirm things actually happened as I imagined them (the did not). Thx and sorry for the noise. Sven
On 10 Dec 2017, at 18:00, Henrik-Nergaard <draagren@outlook.com> wrote:
Hi Sven,
What you are seeing is most likely a $, vs $. issue. See BenchmarkResult >>#printFrequenceOn: it uses both decimal and thousand separators.
If i run this code: ----------------------------------------- | counter | counter := ZnClient new in: [ :client | client loggingOff. [ client get: 'http://localhost:8080'. counter ] bench ]. counter. -----------------------------------------
Then i get 9035 ('1,773 per second') when no inspector is open, and only 22 ('5.995 per second') when inspecting the logs.
Best regards, Henrik
-- Sent from: http://forum.world.st/Pharo-Smalltalk-Developers-f1294837.html

I like that kind of noise because these numbers are very informative. And they show that pharo can be used in heavy scenarios, too
Am 10.12.2017 um 19:14 schrieb Sven Van Caekenberghe <sven@stfx.eu>:
@ Henrik
Arg, arg, arg, yes of course. I actually did think about that, but still did not look carefully enough !! Really stupid of me.
It is even worse because I wrote that code ...
Now, the #printOn: of BenchmarkResult is much clearer, less confusing:
ZnClient new in: [ :client | [ client get: 'http://localhost:8080' ] benchFor: 5 seconds ].
a BenchmarkResult(14,732 iterations in 5 seconds. 2,946 per second)
vs
ZnClient new in: [ :client | client loggingOff. [ client get: 'http://localhost:8080' ] benchFor: 5 seconds ].
a BenchmarkResult(42 iterations in 5 seconds 88 milliseconds. 8.255 per second)
Still the same issue with $, and $. in frequency, but the iteration count is crystal clear.
The reason #bench works like that is backwards compatibility at the time we introduced that.
@ Ben
Yes, I should have looked at the other side as well, to confirm things actually happened as I imagined them (the did not).
Thx and sorry for the noise.
Sven
On 10 Dec 2017, at 18:00, Henrik-Nergaard <draagren@outlook.com> wrote:
Hi Sven,
What you are seeing is most likely a $, vs $. issue. See BenchmarkResult >>#printFrequenceOn: it uses both decimal and thousand separators.
If i run this code: ----------------------------------------- | counter | counter := ZnClient new in: [ :client | client loggingOff. [ client get: 'http://localhost:8080'. counter ] bench ]. counter. -----------------------------------------
Then i get 9035 ('1,773 per second') when no inspector is open, and only 22 ('5.995 per second') when inspecting the logs.
Best regards, Henrik
-- Sent from: http://forum.world.st/Pharo-Smalltalk-Developers-f1294837.html

sven did you submit a fix to get a clearer printout? Stef On Sun, Dec 10, 2017 at 7:14 PM, Sven Van Caekenberghe <sven@stfx.eu> wrote:
@ Henrik
Arg, arg, arg, yes of course. I actually did think about that, but still did not look carefully enough !! Really stupid of me.
It is even worse because I wrote that code ...
Now, the #printOn: of BenchmarkResult is much clearer, less confusing:
ZnClient new in: [ :client | [ client get: 'http://localhost:8080' ] benchFor: 5 seconds ].
a BenchmarkResult(14,732 iterations in 5 seconds. 2,946 per second)
vs
ZnClient new in: [ :client | client loggingOff. [ client get: 'http://localhost:8080' ] benchFor: 5 seconds ].
a BenchmarkResult(42 iterations in 5 seconds 88 milliseconds. 8.255 per second)
Still the same issue with $, and $. in frequency, but the iteration count is crystal clear.
The reason #bench works like that is backwards compatibility at the time we introduced that.
@ Ben
Yes, I should have looked at the other side as well, to confirm things actually happened as I imagined them (the did not).
Thx and sorry for the noise.
Sven
On 10 Dec 2017, at 18:00, Henrik-Nergaard <draagren@outlook.com> wrote:
Hi Sven,
What you are seeing is most likely a $, vs $. issue. See BenchmarkResult >>#printFrequenceOn: it uses both decimal and thousand separators.
If i run this code: ----------------------------------------- | counter | counter := ZnClient new in: [ :client | client loggingOff. [ client get: 'http://localhost:8080'. counter ] bench ]. counter. -----------------------------------------
Then i get 9035 ('1,773 per second') when no inspector is open, and only 22 ('5.995 per second') when inspecting the logs.
Best regards, Henrik
-- Sent from: http://forum.world.st/Pharo-Smalltalk-Developers-f1294837.html
https://pharo.fogbugz.com/f/cases/21232/BenchmarkResult-printFrequencyOn-can... https://github.com/pharo-project/pharo/pull/794
On 12 Dec 2017, at 07:22, Stephane Ducasse <stepharo.self@gmail.com> wrote:
sven did you submit a fix to get a clearer printout?
Stef
On Sun, Dec 10, 2017 at 7:14 PM, Sven Van Caekenberghe <sven@stfx.eu> wrote:
@ Henrik
Arg, arg, arg, yes of course. I actually did think about that, but still did not look carefully enough !! Really stupid of me.
It is even worse because I wrote that code ...
Now, the #printOn: of BenchmarkResult is much clearer, less confusing:
ZnClient new in: [ :client | [ client get: 'http://localhost:8080' ] benchFor: 5 seconds ].
a BenchmarkResult(14,732 iterations in 5 seconds. 2,946 per second)
vs
ZnClient new in: [ :client | client loggingOff. [ client get: 'http://localhost:8080' ] benchFor: 5 seconds ].
a BenchmarkResult(42 iterations in 5 seconds 88 milliseconds. 8.255 per second)
Still the same issue with $, and $. in frequency, but the iteration count is crystal clear.
The reason #bench works like that is backwards compatibility at the time we introduced that.
@ Ben
Yes, I should have looked at the other side as well, to confirm things actually happened as I imagined them (the did not).
Thx and sorry for the noise.
Sven
On 10 Dec 2017, at 18:00, Henrik-Nergaard <draagren@outlook.com> wrote:
Hi Sven,
What you are seeing is most likely a $, vs $. issue. See BenchmarkResult >>#printFrequenceOn: it uses both decimal and thousand separators.
If i run this code: ----------------------------------------- | counter | counter := ZnClient new in: [ :client | client loggingOff. [ client get: 'http://localhost:8080'. counter ] bench ]. counter. -----------------------------------------
Then i get 9035 ('1,773 per second') when no inspector is open, and only 22 ('5.995 per second') when inspecting the logs.
Best regards, Henrik
-- Sent from: http://forum.world.st/Pharo-Smalltalk-Developers-f1294837.html
Tx this is cool! On Sat, Feb 3, 2018 at 12:17 AM, Sven Van Caekenberghe <sven@stfx.eu> wrote:
https://pharo.fogbugz.com/f/cases/21232/BenchmarkResult-printFrequencyOn-can...
https://github.com/pharo-project/pharo/pull/794
On 12 Dec 2017, at 07:22, Stephane Ducasse <stepharo.self@gmail.com> wrote:
sven did you submit a fix to get a clearer printout?
Stef
On Sun, Dec 10, 2017 at 7:14 PM, Sven Van Caekenberghe <sven@stfx.eu> wrote:
@ Henrik
Arg, arg, arg, yes of course. I actually did think about that, but still did not look carefully enough !! Really stupid of me.
It is even worse because I wrote that code ...
Now, the #printOn: of BenchmarkResult is much clearer, less confusing:
ZnClient new in: [ :client | [ client get: 'http://localhost:8080' ] benchFor: 5 seconds ].
a BenchmarkResult(14,732 iterations in 5 seconds. 2,946 per second)
vs
ZnClient new in: [ :client | client loggingOff. [ client get: 'http://localhost:8080' ] benchFor: 5 seconds ].
a BenchmarkResult(42 iterations in 5 seconds 88 milliseconds. 8.255 per second)
Still the same issue with $, and $. in frequency, but the iteration count is crystal clear.
The reason #bench works like that is backwards compatibility at the time we introduced that.
@ Ben
Yes, I should have looked at the other side as well, to confirm things actually happened as I imagined them (the did not).
Thx and sorry for the noise.
Sven
On 10 Dec 2017, at 18:00, Henrik-Nergaard <draagren@outlook.com> wrote:
Hi Sven,
What you are seeing is most likely a $, vs $. issue. See BenchmarkResult >>#printFrequenceOn: it uses both decimal and thousand separators.
If i run this code: ----------------------------------------- | counter | counter := ZnClient new in: [ :client | client loggingOff. [ client get: 'http://localhost:8080'. counter ] bench ]. counter. -----------------------------------------
Then i get 9035 ('1,773 per second') when no inspector is open, and only 22 ('5.995 per second') when inspecting the logs.
Best regards, Henrik
-- Sent from: http://forum.world.st/Pharo-Smalltalk-Developers-f1294837.html

Sven Van Caekenberghe-2 wrote
Hi,
While benchmarking ZnClient I encountered something weird and counter intuitive that I cannot explain.
This was on macOS running Pharo 7 and 6.
First you need to setup a fast local HTTP server, can be anything, for example:
$ brew install nginx $ brew services start nginx $ curl http://localhost:8080
In Pharo, the benchmark code looks as follows:
ZnClient new in: [ :client | [ client get: 'http://localhost:8080' ] bench ].
On my machine this gives about 2500 req/s.
ZnClient uses object logging: it emits special event objects that contain information regarding what happens (full details and timing information) using an Announcer. Subscribers can then decide what to do with this detailed information. This mechanism is always active, but there is an option to turn it totally off for maximum performance:
ZnClient new in: [ :client | client loggingOff. [ client get: 'http://localhost:8080' ] bench ].
This gives about 3000 req/s, a non-trivial + 500 req/s improvement.
Now comes the weird thing. GT contains a custom view for Announcers, inspect:
ZnLogEvent announcer.
And select the Announcements tab. Leave this window open.
Now, the first expression (with full logging enabled and an active subscriber with a UI) is way FASTER than first, it yields about 7000 to 8000 req/s. Since the benchmark runs in the main UI thread, no actual drawing happens until the expression finishes.
Running both expression inside a Time profiler show how in the first case significant time (actually *most* time ;-) is spent in the logging:
In the second case, with logging disabled, that changes to:
One has to take into account that the request has to be processed by the server, so from the client's perspective, most time will always be spent waiting for a reply, #readResponse. With the logging enabled, probably less time is spent waiting, since the client does a bit more work. Still what should be slower is more than 2 times as fast !
I have a feeling that this has to do with scheduling (probably interacting with network IO), as going deep into the last #readResponse above, I see:
But I still cannot understand why doing apparently more work results in faster throughput.
Can anyone explain this behaviour ?
Thx,
Sven
Screen Shot 2017-12-10 at 16.59.36.png (68K) <http://forum.world.st/attachment/5060328/0/Screen%20Shot%202017-12-10%20at%2...; Screen Shot 2017-12-10 at 17.00.28.png (60K) <http://forum.world.st/attachment/5060328/1/Screen%20Shot%202017-12-10%20at%2...; Screen Shot 2017-12-10 at 17.07.39.png (140K) <http://forum.world.st/attachment/5060328/2/Screen%20Shot%202017-12-10%20at%2...;
Just a theory, but iirc, if the vm heartbeat thread isn't running properly, newly arrived external events only gets checked every N executed bytecodes. Could explain an increase in delay times before the socket semaphore is signalled. Should be easily testable, any low-priority thread with an infinite loop would probably do enough work. Cheers, Henry -- Sent from: http://forum.world.st/Pharo-Smalltalk-Developers-f1294837.html
participants (6)
-
 Ben Coman
 -
 Henrik Sperre Johansen
 -
 Henrik-Nergaard
 -
 Norbert Hartl
 -
 Stephane Ducasse
 -
 Sven Van Caekenberghe