[Pharo-project] PluggableListMorph error, how to debug ?

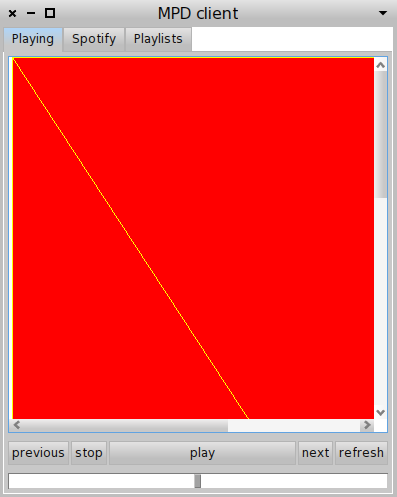
Hi, sometimes I have a PluggableListMorph that displays a big red square (see attached screenshot). How can I debug why this happens ? [image: Inline image 1] Cheers, Laurent

In pharo2.0 you can click on it and it opens a debugger. Stef On Nov 4, 2012, at 6:04 PM, laurent laffont wrote:
Hi,
sometimes I have a PluggableListMorph that displays a big red square (see attached screenshot). How can I debug why this happens ?
<image.png>
Cheers,
Laurent
Cool :) Laurent On Sun, Nov 4, 2012 at 6:13 PM, Stéphane Ducasse <stephane.ducasse@inria.fr>wrote:
In pharo2.0 you can click on it and it opens a debugger.
Stef
On Nov 4, 2012, at 6:04 PM, laurent laffont wrote:
Hi,
sometimes I have a PluggableListMorph that displays a big red square (see attached screenshot). How can I debug why this happens ?
<image.png>
Cheers,
Laurent

In Pharo 1.4, browse Morph Find the method fullDrawOn: and replace on: Error do: [:err | self setProperty: #errorOnDraw toValue: true. self setProperty: #drawError toValue: err freeze. ^ self drawErrorOn: aCanvas ] by: value Now you will have a debugger instead of the red square of death But do it at you own risk ^^ Ben On Nov 4, 2012, at 6:04 PM, laurent laffont wrote:
Hi,
sometimes I have a PluggableListMorph that displays a big red square (see attached screenshot). How can I debug why this happens ?
<image.png>
Cheers,
Laurent
Thanks for the tip ! Laurent On Sun, Nov 4, 2012 at 6:37 PM, Benjamin < benjamin.vanryseghem.pharo@gmail.com> wrote:
In Pharo 1.4, browse Morph Find the method fullDrawOn:
and replace
on: Error do: [:err | self setProperty: #errorOnDraw toValue: true. self setProperty: #drawError toValue: err freeze. ^ self drawErrorOn: aCanvas ]
by: value
Now you will have a debugger instead of the red square of death
But do it at you own risk ^^ Ben
On Nov 4, 2012, at 6:04 PM, laurent laffont wrote:
Hi,
sometimes I have a PluggableListMorph that displays a big red square (see attached screenshot). How can I debug why this happens ?
<image.png>
Cheers,
Laurent

Excellent tip!! Alexandre On Nov 4, 2012, at 2:37 PM, Benjamin <benjamin.vanryseghem.pharo@gmail.com> wrote:
In Pharo 1.4, browse Morph Find the method fullDrawOn:
and replace
on: Error do: [:err | self setProperty: #errorOnDraw toValue: true. self setProperty: #drawError toValue: err freeze. ^ self drawErrorOn: aCanvas ]
by: value
Now you will have a debugger instead of the red square of death
But do it at you own risk ^^ Ben
On Nov 4, 2012, at 6:04 PM, laurent laffont wrote:
Hi,
sometimes I have a PluggableListMorph that displays a big red square (see attached screenshot). How can I debug why this happens ?
<image.png>
Cheers,
Laurent
-- _,.;:~^~:;._,.;:~^~:;._,.;:~^~:;._,.;:~^~:;._,.;: Alexandre Bergel http://www.bergel.eu ^~:;._,.;:~^~:;._,.;:~^~:;._,.;:~^~:;._,.;:~^~:;.

On 04.11.2012 18:37, Benjamin wrote:
In Pharo 1.4, browse Morph Find the method fullDrawOn:
and replace
on: Error do: [:err | self setProperty: #errorOnDraw toValue: true. self setProperty: #drawError toValue: err freeze. ^ self drawErrorOn: aCanvas ]
by: value
Now you will have a debugger instead of the red square of death
But do it at you own risk ^^ Ben
Debugging UI code is one of those places you probably want to insert a haltOnce instead, or risk losing the image :) Cheers, Henry

Hi Laurent, let me share my way of solving this. My method works from a Workspace or Inspector/Explorer. What I do is invoke "drawOn:" manually, passing a NullCanvas (a "dummy" canvas). Suppose I have a reference (in a Workspace/Inspector) for my buggy morph, called "m": m drawOn: (NullCanvas new). This should trigger the debugger and show you the error. You can then debug, explore, fix, change, etc. Repeat as needed. Even if the bug is fixed, the Morph stays in this "erroneous" state. That's why when the bug is fixed you should call "resumeAfterDrawError" on your Morph: m resumeAfterDrawError. And it will re-draw it again. Hope it helps, Sebastian 2012/11/4 laurent laffont <laurent.laffont@gmail.com>
Hi,
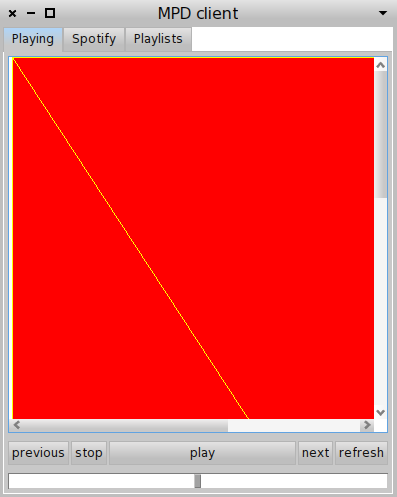
sometimes I have a PluggableListMorph that displays a big red square (see attached screenshot). How can I debug why this happens ?
[image: Inline image 1]
Cheers,
Laurent
Neat trick!
Suppose I have a reference (in a Workspace/Inspector) for my buggy morph, called "m":
m drawOn: (NullCanvas new).
This should trigger the debugger and show you the error. You can then debug, explore, fix, change, etc. Repeat as needed. Even if the bug is fixed, the Morph stays in this "erroneous" state. That's why when the bug is fixed you should call "resumeAfterDrawError" on your Morph:
m resumeAfterDrawError.
And it will re-draw it again.

Stéphane Ducasse wrote
Neat trick!
Suppose I have a reference (in a Workspace/Inspector) for my buggy morph, called "m": m drawOn: (NullCanvas new). ...
The debugging tricks in this thread were too good! I added them to the fogbugz wiki https://pharo.fogbugz.com/default.asp?W84 ----- Cheers, Sean -- View this message in context: http://forum.world.st/PluggableListMorph-error-how-to-debug-tp4653925p473624... Sent from the Pharo Smalltalk Developers mailing list archive at Nabble.com.
participants (7)
-
 Alexandre Bergel
 -
 Benjamin
 -
 Henrik Sperre Johansen
 -
 laurent laffont
 -
 Sean P. DeNigris
 -
 Sebastian Nozzi
 -
 Stéphane Ducasse