[Pharo-project] New profiler for Pharo: tester wanted!

Dear List, Over the last few months I put some effort on a new profiler for Pharo. It has been used on a number of projects. Time has come to share it with you. To install it, just doit the following expression in a workspace (Mondrian will also be installed): -=-=-=-=-=-=-=-=-=-=-=-= Gofer new squeaksource: 'MetacelloRepository'; package: 'ConfigurationOfSpy'; load. (Smalltalk at: #ConfigurationOfSpy) perform: #loadDefault -=-=-=-=-=-=-=-=-=-=-=-= To invoke the profiler, use the following template: ProfilingPackageSpy viewProfiling: [ "YOUR CODE" ] inPackage: 'YourPackageName' ProfilingPackageSpy viewProfiling: [ "YOUR CODE" ] inPackagesMatching: 'PackageName*' Replace "YOUR CODE" by an expression. Some examples are provided in the class ProfilingPackageSpy (method category 'example'). You can find profilings of Mondrian, Glamour, Moose/CAnalyzer, O2. The profiling of Mondrian looks like this: -=-=-=-=-=-=-=-=-=-=-=-= ProfilingPackageSpy viewProfiling: [ | view | view := MOViewRenderer new. view nodes: (1 to: 100) forEach: [:each | view nodes: (1 to: 100)]. view root applyLayout ] inPackage: 'Mondrian' -=-=-=-=-=-=-=-=-=-=-=-= There are two things you should keep in mind: - "YOUR CODE" will be executed twice. The first time with message Tally, then the second time with the full instrumentation. The second execution should not be impacted by the first execution. - You cannot instrument the whole image. I need more time to make this happens. Therefore, you cannot provide '*' to inPackagesMatching: How to read the picture: - big rectangle are classes - edges represent class inheritance - inner rectangles are methods: * height = total time that the method has been executed * width = number of time the method has been executed * color = number of different receiver: white = the method has been executed on 1 receiver. black = many receivers You can do a right-click on a method, and select viewInvocation. This opens a second view that show the execution flow. A different mapping of metrics is used: - rectangle = methods - edges = invocation (upper invokes below) - gray color = method that always return 'self'. It corresponds to void methods in Java or C++. It is therefore likely that the method performs a side effect - yellow color = method that always returns the same value for a particular object - width and height are as in the first visualization Keep in mind that you mind encounter a freeze of your image if you instrument sensitive methods. I would be sincerely delighted to have experience report on this. Regards, Alexandre -- _,.;:~^~:;._,.;:~^~:;._,.;:~^~:;._,.;:~^~:;._,.;: Alexandre Bergel http://www.bergel.eu ^~:;._,.;:~^~:;._,.;:~^~:;._,.;:~^~:;._,.;:~^~:;.

El mar, 19-01-2010 a las 22:03 -0300, Alexandre Bergel escribió:
Dear List,
Over the last few months I put some effort on a new profiler for Pharo. It has been used on a number of projects. Time has come to share it with you. To install it, just doit the following expression in a workspace (Mondrian will also be installed): -=-=-=-=-=-=-=-=-=-=-=-= Gofer new squeaksource: 'MetacelloRepository'; package: 'ConfigurationOfSpy'; load. (Smalltalk at: #ConfigurationOfSpy) perform: #loadDefault -=-=-=-=-=-=-=-=-=-=-=-=
I tried it in a PharoCore 1.0 10506 and I get a lot of deprecation warnings for gofer addPackage:, addVersion: The method Gofer addVersion: has been deprecated. Instead of #addVersion: simply use #version: Select Proceed to continue, or close this window to cancel the operation. I pressed proceed and then I got: MetacelloGoferPackage(Object)>>doesNotUnderstand: #setName. Is this for 1.0, what version? Cheers
To invoke the profiler, use the following template: ProfilingPackageSpy viewProfiling: [ "YOUR CODE" ] inPackage: 'YourPackageName' ProfilingPackageSpy viewProfiling: [ "YOUR CODE" ] inPackagesMatching: 'PackageName*'
Replace "YOUR CODE" by an expression. Some examples are provided in the class ProfilingPackageSpy (method category 'example'). You can find profilings of Mondrian, Glamour, Moose/CAnalyzer, O2. The profiling of Mondrian looks like this: -=-=-=-=-=-=-=-=-=-=-=-= ProfilingPackageSpy viewProfiling: [ | view | view := MOViewRenderer new. view nodes: (1 to: 100) forEach: [:each | view nodes: (1 to: 100)]. view root applyLayout ] inPackage: 'Mondrian' -=-=-=-=-=-=-=-=-=-=-=-=
There are two things you should keep in mind: - "YOUR CODE" will be executed twice. The first time with message Tally, then the second time with the full instrumentation. The second execution should not be impacted by the first execution. - You cannot instrument the whole image. I need more time to make this happens. Therefore, you cannot provide '*' to inPackagesMatching:
How to read the picture: - big rectangle are classes - edges represent class inheritance - inner rectangles are methods: * height = total time that the method has been executed * width = number of time the method has been executed * color = number of different receiver: white = the method has been executed on 1 receiver. black = many receivers
You can do a right-click on a method, and select viewInvocation. This opens a second view that show the execution flow. A different mapping of metrics is used: - rectangle = methods - edges = invocation (upper invokes below) - gray color = method that always return 'self'. It corresponds to void methods in Java or C++. It is therefore likely that the method performs a side effect - yellow color = method that always returns the same value for a particular object - width and height are as in the first visualization
Keep in mind that you mind encounter a freeze of your image if you instrument sensitive methods.
I would be sincerely delighted to have experience report on this.
Regards, Alexandre
-- Miguel Cobá http://miguel.leugim.com.mx

Strange, I tried in a 10505 and I got no warning. I will try later today. Alexandre
I tried it in a PharoCore 1.0 10506 and I get a lot of deprecation warnings for gofer addPackage:, addVersion:
The method Gofer addVersion: has been deprecated. Instead of #addVersion: simply use #version:
Select Proceed to continue, or close this window to cancel the operation.
I pressed proceed and then I got:
MetacelloGoferPackage(Object)>>doesNotUnderstand: #setName.
Is this for 1.0, what version?
Cheers
To invoke the profiler, use the following template: ProfilingPackageSpy viewProfiling: [ "YOUR CODE" ] inPackage: 'YourPackageName' ProfilingPackageSpy viewProfiling: [ "YOUR CODE" ] inPackagesMatching: 'PackageName*'
Replace "YOUR CODE" by an expression. Some examples are provided in the class ProfilingPackageSpy (method category 'example'). You can find profilings of Mondrian, Glamour, Moose/CAnalyzer, O2. The profiling of Mondrian looks like this: -=-=-=-=-=-=-=-=-=-=-=-= ProfilingPackageSpy viewProfiling: [ | view | view := MOViewRenderer new. view nodes: (1 to: 100) forEach: [:each | view nodes: (1 to: 100)]. view root applyLayout ] inPackage: 'Mondrian' -=-=-=-=-=-=-=-=-=-=-=-=
There are two things you should keep in mind: - "YOUR CODE" will be executed twice. The first time with message Tally, then the second time with the full instrumentation. The second execution should not be impacted by the first execution. - You cannot instrument the whole image. I need more time to make this happens. Therefore, you cannot provide '*' to inPackagesMatching:
How to read the picture: - big rectangle are classes - edges represent class inheritance - inner rectangles are methods: * height = total time that the method has been executed * width = number of time the method has been executed * color = number of different receiver: white = the method has been executed on 1 receiver. black = many receivers
You can do a right-click on a method, and select viewInvocation. This opens a second view that show the execution flow. A different mapping of metrics is used: - rectangle = methods - edges = invocation (upper invokes below) - gray color = method that always return 'self'. It corresponds to void methods in Java or C++. It is therefore likely that the method performs a side effect - yellow color = method that always returns the same value for a particular object - width and height are as in the first visualization
Keep in mind that you mind encounter a freeze of your image if you instrument sensitive methods.
I would be sincerely delighted to have experience report on this.
Regards, Alexandre
-- Miguel Cobá http://miguel.leugim.com.mx
_______________________________________________ Pharo-project mailing list Pharo-project@lists.gforge.inria.fr http://lists.gforge.inria.fr/cgi-bin/mailman/listinfo/pharo-project
-- _,.;:~^~:;._,.;:~^~:;._,.;:~^~:;._,.;:~^~:;._,.;: Alexandre Bergel http://www.bergel.eu ^~:;._,.;:~^~:;._,.;:~^~:;._,.;:~^~:;._,.;:~^~:;.

I also got the warnings and an error in the end. Adrian On Jan 20, 2010, at 12:06 , Alexandre Bergel wrote:
Strange, I tried in a 10505 and I got no warning. I will try later today.
Alexandre
I tried it in a PharoCore 1.0 10506 and I get a lot of deprecation warnings for gofer addPackage:, addVersion:
The method Gofer addVersion: has been deprecated. Instead of #addVersion: simply use #version:
Select Proceed to continue, or close this window to cancel the operation.
I pressed proceed and then I got:
MetacelloGoferPackage(Object)>>doesNotUnderstand: #setName.
Is this for 1.0, what version?
Cheers
To invoke the profiler, use the following template: ProfilingPackageSpy viewProfiling: [ "YOUR CODE" ] inPackage: 'YourPackageName' ProfilingPackageSpy viewProfiling: [ "YOUR CODE" ] inPackagesMatching: 'PackageName*'
Replace "YOUR CODE" by an expression. Some examples are provided in the class ProfilingPackageSpy (method category 'example'). You can find profilings of Mondrian, Glamour, Moose/CAnalyzer, O2. The profiling of Mondrian looks like this: -=-=-=-=-=-=-=-=-=-=-=-= ProfilingPackageSpy viewProfiling: [ | view | view := MOViewRenderer new. view nodes: (1 to: 100) forEach: [:each | view nodes: (1 to: 100)]. view root applyLayout ] inPackage: 'Mondrian' -=-=-=-=-=-=-=-=-=-=-=-=
There are two things you should keep in mind: - "YOUR CODE" will be executed twice. The first time with message Tally, then the second time with the full instrumentation. The second execution should not be impacted by the first execution. - You cannot instrument the whole image. I need more time to make this happens. Therefore, you cannot provide '*' to inPackagesMatching:
How to read the picture: - big rectangle are classes - edges represent class inheritance - inner rectangles are methods: * height = total time that the method has been executed * width = number of time the method has been executed * color = number of different receiver: white = the method has been executed on 1 receiver. black = many receivers
You can do a right-click on a method, and select viewInvocation. This opens a second view that show the execution flow. A different mapping of metrics is used: - rectangle = methods - edges = invocation (upper invokes below) - gray color = method that always return 'self'. It corresponds to void methods in Java or C++. It is therefore likely that the method performs a side effect - yellow color = method that always returns the same value for a particular object - width and height are as in the first visualization
Keep in mind that you mind encounter a freeze of your image if you instrument sensitive methods.
I would be sincerely delighted to have experience report on this.
Regards, Alexandre
-- Miguel Cobá http://miguel.leugim.com.mx
_______________________________________________ Pharo-project mailing list Pharo-project@lists.gforge.inria.fr http://lists.gforge.inria.fr/cgi-bin/mailman/listinfo/pharo-project
-- _,.;:~^~:;._,.;:~^~:;._,.;:~^~:;._,.;:~^~:;._,.;: Alexandre Bergel http://www.bergel.eu ^~:;._,.;:~^~:;._,.;:~^~:;._,.;:~^~:;._,.;:~^~:;.
_______________________________________________ Pharo-project mailing list Pharo-project@lists.gforge.inria.fr http://lists.gforge.inria.fr/cgi-bin/mailman/listinfo/pharo-project

The problem is in ConfigurationOfSpy class >> ensureMetacello That method is wrong (it is old). You have to updated to something like this: http://code.google.com/p/metacello/wiki/EnsureMetacello Cheers MAriano On Wed, Jan 20, 2010 at 12:11 PM, Adrian Lienhard <adi@netstyle.ch> wrote:
I also got the warnings and an error in the end.
Adrian
On Jan 20, 2010, at 12:06 , Alexandre Bergel wrote:
Strange, I tried in a 10505 and I got no warning. I will try later today.
Alexandre
I tried it in a PharoCore 1.0 10506 and I get a lot of deprecation warnings for gofer addPackage:, addVersion:
The method Gofer addVersion: has been deprecated. Instead of #addVersion: simply use #version:
Select Proceed to continue, or close this window to cancel the operation.
I pressed proceed and then I got:
MetacelloGoferPackage(Object)>>doesNotUnderstand: #setName.
Is this for 1.0, what version?
Cheers
To invoke the profiler, use the following template: ProfilingPackageSpy viewProfiling: [ "YOUR CODE" ] inPackage: 'YourPackageName' ProfilingPackageSpy viewProfiling: [ "YOUR CODE" ] inPackagesMatching: 'PackageName*'
Replace "YOUR CODE" by an expression. Some examples are provided in the class ProfilingPackageSpy (method category 'example'). You can find profilings of Mondrian, Glamour, Moose/CAnalyzer, O2. The profiling of Mondrian looks like this: -=-=-=-=-=-=-=-=-=-=-=-= ProfilingPackageSpy viewProfiling: [ | view | view := MOViewRenderer new. view nodes: (1 to: 100) forEach: [:each | view
nodes: (1 to:
100)]. view root applyLayout ] inPackage: 'Mondrian' -=-=-=-=-=-=-=-=-=-=-=-=
There are two things you should keep in mind: - "YOUR CODE" will be executed twice. The first time with message Tally, then the second time with the full instrumentation. The second execution should not be impacted by the first execution. - You cannot instrument the whole image. I need more time to make this happens. Therefore, you cannot provide '*' to inPackagesMatching:
How to read the picture: - big rectangle are classes - edges represent class inheritance - inner rectangles are methods: * height = total time that the method has been executed * width = number of time the method has been executed * color = number of different receiver: white = the method has been executed on 1 receiver. black = many receivers
You can do a right-click on a method, and select viewInvocation. This opens a second view that show the execution flow. A different mapping of metrics is used: - rectangle = methods - edges = invocation (upper invokes below) - gray color = method that always return 'self'. It corresponds to void methods in Java or C++. It is therefore likely that the method performs a side effect - yellow color = method that always returns the same value for a particular object - width and height are as in the first visualization
Keep in mind that you mind encounter a freeze of your image if you instrument sensitive methods.
I would be sincerely delighted to have experience report on this.
Regards, Alexandre
-- Miguel Cobá http://miguel.leugim.com.mx
_______________________________________________ Pharo-project mailing list Pharo-project@lists.gforge.inria.fr http://lists.gforge.inria.fr/cgi-bin/mailman/listinfo/pharo-project
-- _,.;:~^~:;._,.;:~^~:;._,.;:~^~:;._,.;:~^~:;._,.;: Alexandre Bergel http://www.bergel.eu ^~:;._,.;:~^~:;._,.;:~^~:;._,.;:~^~:;._,.;:~^~:;.
_______________________________________________ Pharo-project mailing list Pharo-project@lists.gforge.inria.fr http://lists.gforge.inria.fr/cgi-bin/mailman/listinfo/pharo-project
_______________________________________________ Pharo-project mailing list Pharo-project@lists.gforge.inria.fr http://lists.gforge.inria.fr/cgi-bin/mailman/listinfo/pharo-project
Each implementor of #ensureMetacello is different. Even the one of ConfigurationOfMetacello is different from the one of the website :-) I update ConfigurationOfSpy. It loads now without any problem. Cheers, Alexandre On 20 Jan 2010, at 09:16, Mariano Martinez Peck wrote:
The problem is in ConfigurationOfSpy class >> ensureMetacello
That method is wrong (it is old). You have to updated to something like this:
http://code.google.com/p/metacello/wiki/EnsureMetacello
Cheers
MAriano
On Wed, Jan 20, 2010 at 12:11 PM, Adrian Lienhard <adi@netstyle.ch> wrote: I also got the warnings and an error in the end.
Adrian
On Jan 20, 2010, at 12:06 , Alexandre Bergel wrote:
Strange, I tried in a 10505 and I got no warning. I will try later today.
Alexandre
I tried it in a PharoCore 1.0 10506 and I get a lot of deprecation warnings for gofer addPackage:, addVersion:
The method Gofer addVersion: has been deprecated. Instead of #addVersion: simply use #version:
Select Proceed to continue, or close this window to cancel the operation.
I pressed proceed and then I got:
MetacelloGoferPackage(Object)>>doesNotUnderstand: #setName.
Is this for 1.0, what version?
Cheers
To invoke the profiler, use the following template: ProfilingPackageSpy viewProfiling: [ "YOUR CODE" ] inPackage: 'YourPackageName' ProfilingPackageSpy viewProfiling: [ "YOUR CODE" ] inPackagesMatching: 'PackageName*'
Replace "YOUR CODE" by an expression. Some examples are provided
in
the class ProfilingPackageSpy (method category 'example'). You can find profilings of Mondrian, Glamour, Moose/CAnalyzer, O2. The profiling of Mondrian looks like this: -=-=-=-=-=-=-=-=-=-=-=-= ProfilingPackageSpy viewProfiling: [ | view | view := MOViewRenderer new. view nodes: (1 to: 100) forEach: [:each | view nodes: (1 to: 100)]. view root applyLayout ] inPackage: 'Mondrian' -=-=-=-=-=-=-=-=-=-=-=-=
There are two things you should keep in mind: - "YOUR CODE" will be executed twice. The first time with message Tally, then the second time with the full instrumentation. The second execution should not be impacted by the first execution. - You cannot instrument the whole image. I need more time to make this happens. Therefore, you cannot provide '*' to inPackagesMatching:
How to read the picture: - big rectangle are classes - edges represent class inheritance - inner rectangles are methods: * height = total time that the method has been executed * width = number of time the method has been executed * color = number of different receiver: white = the method has been executed on 1 receiver. black = many receivers
You can do a right-click on a method, and select viewInvocation. This opens a second view that show the execution flow. A different mapping of metrics is used: - rectangle = methods - edges = invocation (upper invokes below) - gray color = method that always return 'self'. It corresponds to void methods in Java or C++. It is therefore likely that the method performs a side effect - yellow color = method that always returns the same value for a particular object - width and height are as in the first visualization
Keep in mind that you mind encounter a freeze of your image if you instrument sensitive methods.
I would be sincerely delighted to have experience report on this.
Regards, Alexandre
-- Miguel Cobá http://miguel.leugim.com.mx
_______________________________________________ Pharo-project mailing list Pharo-project@lists.gforge.inria.fr http://lists.gforge.inria.fr/cgi-bin/mailman/listinfo/pharo-project
-- _,.;:~^~:;._,.;:~^~:;._,.;:~^~:;._,.;:~^~:;._,.;: Alexandre Bergel http://www.bergel.eu ^~:;._,.;:~^~:;._,.;:~^~:;._,.;:~^~:;._,.;:~^~:;.
_______________________________________________ Pharo-project mailing list Pharo-project@lists.gforge.inria.fr http://lists.gforge.inria.fr/cgi-bin/mailman/listinfo/pharo-project
_______________________________________________ Pharo-project mailing list Pharo-project@lists.gforge.inria.fr http://lists.gforge.inria.fr/cgi-bin/mailman/listinfo/pharo-project
_______________________________________________ Pharo-project mailing list Pharo-project@lists.gforge.inria.fr http://lists.gforge.inria.fr/cgi-bin/mailman/listinfo/pharo-project
-- _,.;:~^~:;._,.;:~^~:;._,.;:~^~:;._,.;:~^~:;._,.;: Alexandre Bergel http://www.bergel.eu ^~:;._,.;:~^~:;._,.;:~^~:;._,.;:~^~:;._,.;:~^~:;.

You know I"m trying to integrate a microsecond clock into the VM. It might be interesting if you run on a macintosh to try a test V5 VM I can supply to see what happens if you change your time collecting from the millisecond clock to the microsecond clock. On 2010-01-20, at 11:20 AM, Alexandre Bergel wrote:
Each implementor of #ensureMetacello is different. Even the one of ConfigurationOfMetacello is different from the one of the website :-)
I update ConfigurationOfSpy. It loads now without any problem.
Cheers, Alexandre
-- =========================================================================== John M. McIntosh <johnmci@smalltalkconsulting.com> Twitter: squeaker68882 Corporate Smalltalk Consulting Ltd. http://www.smalltalkconsulting.com ===========================================================================
The millisecond grain information is obtained from MessageTally. How do I access this microsecond clock? Something like "Time class>>#microsecondClock" ? Cheers, Alexandre On 20 Jan 2010, at 16:24, John M McIntosh wrote:
You know I"m trying to integrate a microsecond clock into the VM. It might be interesting if you run on a macintosh to try a test V5 VM I can supply to see what happens if you change your time collecting from the millisecond clock to the microsecond clock.
On 2010-01-20, at 11:20 AM, Alexandre Bergel wrote:
Each implementor of #ensureMetacello is different. Even the one of ConfigurationOfMetacello is different from the one of the website :-)
I update ConfigurationOfSpy. It loads now without any problem.
Cheers, Alexandre
-- = = = = = ====================================================================== John M. McIntosh <johnmci@smalltalkconsulting.com> Twitter: squeaker68882 Corporate Smalltalk Consulting Ltd. http:// www.smalltalkconsulting.com = = = = = ======================================================================
_______________________________________________ Pharo-project mailing list Pharo-project@lists.gforge.inria.fr http://lists.gforge.inria.fr/cgi-bin/mailman/listinfo/pharo-project
-- _,.;:~^~:;._,.;:~^~:;._,.;:~^~:;._,.;:~^~:;._,.;: Alexandre Bergel http://www.bergel.eu ^~:;._,.;:~^~:;._,.;:~^~:;._,.;:~^~:;._,.;:~^~:;.

On Wed, 20 Jan 2010, Alexandre Bergel wrote:
The millisecond grain information is obtained from MessageTally. How do I access this microsecond clock? Something like "Time class>>#microsecondClock" ?
You have to create that method since it doesn't exist. Something like: Time class >> microsecondClock <primitive: 'primitiveMicrosecondClock'> self primitiveFailed shoud do it. Levente
Cheers, Alexandre
On 20 Jan 2010, at 16:24, John M McIntosh wrote:
You know I"m trying to integrate a microsecond clock into the VM. It might be interesting if you run on a macintosh to try a test V5 VM I can supply to see what happens if you change your time collecting from the millisecond clock to the microsecond clock.
On 2010-01-20, at 11:20 AM, Alexandre Bergel wrote:
Each implementor of #ensureMetacello is different. Even the one of ConfigurationOfMetacello is different from the one of the website :-)
I update ConfigurationOfSpy. It loads now without any problem.
Cheers, Alexandre
-- = = = = = ====================================================================== John M. McIntosh <johnmci@smalltalkconsulting.com> Twitter: squeaker68882 Corporate Smalltalk Consulting Ltd. http:// www.smalltalkconsulting.com = = = = = ======================================================================
_______________________________________________ Pharo-project mailing list Pharo-project@lists.gforge.inria.fr http://lists.gforge.inria.fr/cgi-bin/mailman/listinfo/pharo-project
-- _,.;:~^~:;._,.;:~^~:;._,.;:~^~:;._,.;:~^~:;._,.;: Alexandre Bergel http://www.bergel.eu ^~:;._,.;:~^~:;._,.;:~^~:;._,.;:~^~:;._,.;:~^~:;.
_______________________________________________ Pharo-project mailing list Pharo-project@lists.gforge.inria.fr http://lists.gforge.inria.fr/cgi-bin/mailman/listinfo/pharo-project
Are you on a mac? Of not I'll send the vmmaker, source code and smalltlak changes On 1/20/10, Levente Uzonyi <leves@elte.hu> wrote:
On Wed, 20 Jan 2010, Alexandre Bergel wrote:
The millisecond grain information is obtained from MessageTally. How do I access this microsecond clock? Something like "Time class>>#microsecondClock" ?
You have to create that method since it doesn't exist. Something like:
Time class >> microsecondClock
<primitive: 'primitiveMicrosecondClock'> self primitiveFailed
shoud do it.
Levente
Cheers, Alexandre
On 20 Jan 2010, at 16:24, John M McIntosh wrote:
You know I"m trying to integrate a microsecond clock into the VM. It might be interesting if you run on a macintosh to try a test V5 VM I can supply to see what happens if you change your time collecting from the millisecond clock to the microsecond clock.
On 2010-01-20, at 11:20 AM, Alexandre Bergel wrote:
Each implementor of #ensureMetacello is different. Even the one of ConfigurationOfMetacello is different from the one of the website :-)
I update ConfigurationOfSpy. It loads now without any problem.
Cheers, Alexandre
-- = = = = = ====================================================================== John M. McIntosh <johnmci@smalltalkconsulting.com> Twitter: squeaker68882 Corporate Smalltalk Consulting Ltd. http:// www.smalltalkconsulting.com = = = = = ======================================================================
_______________________________________________ Pharo-project mailing list Pharo-project@lists.gforge.inria.fr http://lists.gforge.inria.fr/cgi-bin/mailman/listinfo/pharo-project
-- _,.;:~^~:;._,.;:~^~:;._,.;:~^~:;._,.;:~^~:;._,.;: Alexandre Bergel http://www.bergel.eu ^~:;._,.;:~^~:;._,.;:~^~:;._,.;:~^~:;._,.;:~^~:;.
_______________________________________________ Pharo-project mailing list Pharo-project@lists.gforge.inria.fr http://lists.gforge.inria.fr/cgi-bin/mailman/listinfo/pharo-project
_______________________________________________ Pharo-project mailing list Pharo-project@lists.gforge.inria.fr http://lists.gforge.inria.fr/cgi-bin/mailman/listinfo/pharo-project
-- =========================================================================== John M. McIntosh <johnmci@smalltalkconsulting.com> Corporate Smalltalk Consulting Ltd. http://www.smalltalkconsulting.com ===========================================================================
On Wed, 20 Jan 2010, John McIntosh wrote:
Are you on a mac? Of not I'll send the vmmaker, source code and smalltlak changes
I'm using windows, so send sources/changes please. Levente
On 1/20/10, Levente Uzonyi <leves@elte.hu> wrote:
On Wed, 20 Jan 2010, Alexandre Bergel wrote:
The millisecond grain information is obtained from MessageTally. How do I access this microsecond clock? Something like "Time class>>#microsecondClock" ?
You have to create that method since it doesn't exist. Something like:
Time class >> microsecondClock
<primitive: 'primitiveMicrosecondClock'> self primitiveFailed
shoud do it.
Levente
Cheers, Alexandre
On 20 Jan 2010, at 16:24, John M McIntosh wrote:
You know I"m trying to integrate a microsecond clock into the VM. It might be interesting if you run on a macintosh to try a test V5 VM I can supply to see what happens if you change your time collecting from the millisecond clock to the microsecond clock.
On 2010-01-20, at 11:20 AM, Alexandre Bergel wrote:
Each implementor of #ensureMetacello is different. Even the one of ConfigurationOfMetacello is different from the one of the website :-)
I update ConfigurationOfSpy. It loads now without any problem.
Cheers, Alexandre
-- = = = = = ====================================================================== John M. McIntosh <johnmci@smalltalkconsulting.com> Twitter: squeaker68882 Corporate Smalltalk Consulting Ltd. http:// www.smalltalkconsulting.com = = = = = ======================================================================
_______________________________________________ Pharo-project mailing list Pharo-project@lists.gforge.inria.fr http://lists.gforge.inria.fr/cgi-bin/mailman/listinfo/pharo-project
-- _,.;:~^~:;._,.;:~^~:;._,.;:~^~:;._,.;:~^~:;._,.;: Alexandre Bergel http://www.bergel.eu ^~:;._,.;:~^~:;._,.;:~^~:;._,.;:~^~:;._,.;:~^~:;.
_______________________________________________ Pharo-project mailing list Pharo-project@lists.gforge.inria.fr http://lists.gforge.inria.fr/cgi-bin/mailman/listinfo/pharo-project
_______________________________________________ Pharo-project mailing list Pharo-project@lists.gforge.inria.fr http://lists.gforge.inria.fr/cgi-bin/mailman/listinfo/pharo-project
-- =========================================================================== John M. McIntosh <johnmci@smalltalkconsulting.com> Corporate Smalltalk Consulting Ltd. http://www.smalltalkconsulting.com ===========================================================================
_______________________________________________ Pharo-project mailing list Pharo-project@lists.gforge.inria.fr http://lists.gforge.inria.fr/cgi-bin/mailman/listinfo/pharo-project
Hi John, I tried 64bitImage*64bitVM, but the primitive fails. I attached a screenshot. Cheers, Alexandre On 20 Jan 2010, at 19:59, John McIntosh wrote:
Are you on a mac? Of not I'll send the vmmaker, source code and smalltlak changes
On 1/20/10, Levente Uzonyi <leves@elte.hu> wrote:
On Wed, 20 Jan 2010, Alexandre Bergel wrote:
The millisecond grain information is obtained from MessageTally. How do I access this microsecond clock? Something like "Time class>>#microsecondClock" ?
You have to create that method since it doesn't exist. Something like:
Time class >> microsecondClock
<primitive: 'primitiveMicrosecondClock'> self primitiveFailed
shoud do it.
Levente
Cheers, Alexandre
On 20 Jan 2010, at 16:24, John M McIntosh wrote:
You know I"m trying to integrate a microsecond clock into the VM. It might be interesting if you run on a macintosh to try a test V5 VM I can supply to see what happens if you change your time collecting from the millisecond clock to the microsecond clock.
On 2010-01-20, at 11:20 AM, Alexandre Bergel wrote:
Each implementor of #ensureMetacello is different. Even the one of ConfigurationOfMetacello is different from the one of the website :-)
I update ConfigurationOfSpy. It loads now without any problem.
Cheers, Alexandre
-- = = = = = = = = =================================================================== John M. McIntosh <johnmci@smalltalkconsulting.com> Twitter: squeaker68882 Corporate Smalltalk Consulting Ltd. http:// www.smalltalkconsulting.com = = = = = = = = ===================================================================
_______________________________________________ Pharo-project mailing list Pharo-project@lists.gforge.inria.fr http://lists.gforge.inria.fr/cgi-bin/mailman/listinfo/pharo-project
-- _,.;:~^~:;._,.;:~^~:;._,.;:~^~:;._,.;:~^~:;._,.;: Alexandre Bergel http://www.bergel.eu ^~:;._,.;:~^~:;._,.;:~^~:;._,.;:~^~:;._,.;:~^~:;.
_______________________________________________ Pharo-project mailing list Pharo-project@lists.gforge.inria.fr http://lists.gforge.inria.fr/cgi-bin/mailman/listinfo/pharo-project
_______________________________________________ Pharo-project mailing list Pharo-project@lists.gforge.inria.fr http://lists.gforge.inria.fr/cgi-bin/mailman/listinfo/pharo-project
-- = = = = = ====================================================================== John M. McIntosh <johnmci@smalltalkconsulting.com> Corporate Smalltalk Consulting Ltd. http:// www.smalltalkconsulting.com = = = = = ======================================================================
_______________________________________________ Pharo-project mailing list Pharo-project@lists.gforge.inria.fr http://lists.gforge.inria.fr/cgi-bin/mailman/listinfo/pharo-project
-- _,.;:~^~:;._,.;:~^~:;._,.;:~^~:;._,.;:~^~:;._,.;: Alexandre Bergel http://www.bergel.eu ^~:;._,.;:~^~:;._,.;:~^~:;._,.;:~^~:;._,.;:~^~:;.
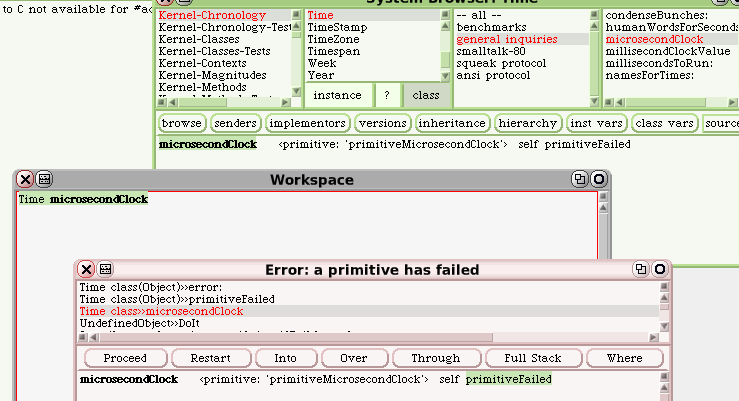
Yes, I've not yet built a publicly available VM that has it. Did you want it for both 32 and 64bit images? On 2010-01-20, at 5:26 PM, Alexandre Bergel wrote:
Hi John,
I tried 64bitImage*64bitVM, but the primitive fails. I attached a screenshot.
Cheers, Alexandre
<Picture 1.png>
-- =========================================================================== John M. McIntosh <johnmci@smalltalkconsulting.com> Twitter: squeaker68882 Corporate Smalltalk Consulting Ltd. http://www.smalltalkconsulting.com ===========================================================================
Yes, I've not yet built a publicly available VM that has it.
Did you want it for both 32 and 64bit images?
No, just the image contained in 64bitImage*64bitVM with Squeak V5 SLOW VERSION Alexandre
On 2010-01-20, at 5:26 PM, Alexandre Bergel wrote:
Hi John,
I tried 64bitImage*64bitVM, but the primitive fails. I attached a screenshot.
Cheers, Alexandre
<Picture 1.png>
-- = = = = = ====================================================================== John M. McIntosh <johnmci@smalltalkconsulting.com> Twitter: squeaker68882 Corporate Smalltalk Consulting Ltd. http:// www.smalltalkconsulting.com = = = = = ======================================================================
_______________________________________________ Pharo-project mailing list Pharo-project@lists.gforge.inria.fr http://lists.gforge.inria.fr/cgi-bin/mailman/listinfo/pharo-project
-- _,.;:~^~:;._,.;:~^~:;._,.;:~^~:;._,.;:~^~:;._,.;: Alexandre Bergel http://www.bergel.eu ^~:;._,.;:~^~:;._,.;:~^~:;._,.;:~^~:;._,.;:~^~:;.
I was wondering whether MessageTally could have a better precision now that there is this primitive. I am not an expert in processes, maybe this is not easily doable. Alexandre On 20 Jan 2010, at 19:46, Levente Uzonyi wrote:
On Wed, 20 Jan 2010, Alexandre Bergel wrote:
The millisecond grain information is obtained from MessageTally. How do I access this microsecond clock? Something like "Time class>>#microsecondClock" ?
You have to create that method since it doesn't exist. Something like:
Time class >> microsecondClock
<primitive: 'primitiveMicrosecondClock'> self primitiveFailed
shoud do it.
Levente
Cheers, Alexandre
On 20 Jan 2010, at 16:24, John M McIntosh wrote:
You know I"m trying to integrate a microsecond clock into the VM. It might be interesting if you run on a macintosh to try a test V5 VM I can supply to see what happens if you change your time collecting from the millisecond clock to the microsecond clock.
On 2010-01-20, at 11:20 AM, Alexandre Bergel wrote:
Each implementor of #ensureMetacello is different. Even the one of ConfigurationOfMetacello is different from the one of the website :-)
I update ConfigurationOfSpy. It loads now without any problem.
Cheers, Alexandre
-- = = = = = = = ==================================================================== John M. McIntosh <johnmci@smalltalkconsulting.com> Twitter: squeaker68882 Corporate Smalltalk Consulting Ltd. http:// www.smalltalkconsulting.com = = = = = = = ====================================================================
_______________________________________________ Pharo-project mailing list Pharo-project@lists.gforge.inria.fr http://lists.gforge.inria.fr/cgi-bin/mailman/listinfo/pharo-project
-- _,.;:~^~:;._,.;:~^~:;._,.;:~^~:;._,.;:~^~:;._,.;: Alexandre Bergel http://www.bergel.eu ^~:;._,.;:~^~:;._,.;:~^~:;._,.;:~^~:;._,.;:~^~:;.
_______________________________________________ Pharo-project mailing list Pharo-project@lists.gforge.inria.fr http://lists.gforge.inria.fr/cgi-bin/mailman/listinfo/pharo-project
_______________________________________________ Pharo-project mailing list Pharo-project@lists.gforge.inria.fr http://lists.gforge.inria.fr/cgi-bin/mailman/listinfo/pharo-project
-- _,.;:~^~:;._,.;:~^~:;._,.;:~^~:;._,.;:~^~:;._,.;: Alexandre Bergel http://www.bergel.eu ^~:;._,.;:~^~:;._,.;:~^~:;._,.;:~^~:;._,.;:~^~:;.
Hi Alex That looks very interesting! I didn't profile a real case yet, so I cannot say how useful it is for me in real life. It seems that you can quickly identify slow and often called methods (is the latter really important because if the method is often called but very fast, that's ok?!). On the other hand, what I miss compared to message tally is to directly see the call relationship of methods. With your second view you compensate for that a bit, but with the hover tooltips, it can be cumbersome to understand a call graph. Cheers, Adrian BTW, to open a class you have the O2 browser hardcoded, which did not work in my image because it was not loaded. I suggest to instead use "ToolSet browse: ... selector: ..." instead. On Jan 20, 2010, at 20:20 , Alexandre Bergel wrote:
Each implementor of #ensureMetacello is different. Even the one of ConfigurationOfMetacello is different from the one of the website :-)
I update ConfigurationOfSpy. It loads now without any problem.
Cheers, Alexandre
On 20 Jan 2010, at 09:16, Mariano Martinez Peck wrote:
The problem is in ConfigurationOfSpy class >> ensureMetacello
That method is wrong (it is old). You have to updated to something like this:
http://code.google.com/p/metacello/wiki/EnsureMetacello
Cheers
MAriano
On Wed, Jan 20, 2010 at 12:11 PM, Adrian Lienhard <adi@netstyle.ch> wrote: I also got the warnings and an error in the end.
Adrian
On Jan 20, 2010, at 12:06 , Alexandre Bergel wrote:
Strange, I tried in a 10505 and I got no warning. I will try later today.
Alexandre
I tried it in a PharoCore 1.0 10506 and I get a lot of deprecation warnings for gofer addPackage:, addVersion:
The method Gofer addVersion: has been deprecated. Instead of #addVersion: simply use #version:
Select Proceed to continue, or close this window to cancel the operation.
I pressed proceed and then I got:
MetacelloGoferPackage(Object)>>doesNotUnderstand: #setName.
Is this for 1.0, what version?
Cheers
To invoke the profiler, use the following template: ProfilingPackageSpy viewProfiling: [ "YOUR CODE" ] inPackage: 'YourPackageName' ProfilingPackageSpy viewProfiling: [ "YOUR CODE" ] inPackagesMatching: 'PackageName*'
Replace "YOUR CODE" by an expression. Some examples are provided
in
the class ProfilingPackageSpy (method category 'example'). You can find profilings of Mondrian, Glamour, Moose/CAnalyzer, O2. The profiling of Mondrian looks like this: -=-=-=-=-=-=-=-=-=-=-=-= ProfilingPackageSpy viewProfiling: [ | view | view := MOViewRenderer new. view nodes: (1 to: 100) forEach: [:each | view nodes: (1 to: 100)]. view root applyLayout ] inPackage: 'Mondrian' -=-=-=-=-=-=-=-=-=-=-=-=
There are two things you should keep in mind: - "YOUR CODE" will be executed twice. The first time with message Tally, then the second time with the full instrumentation. The second execution should not be impacted by the first execution. - You cannot instrument the whole image. I need more time to make this happens. Therefore, you cannot provide '*' to inPackagesMatching:
How to read the picture: - big rectangle are classes - edges represent class inheritance - inner rectangles are methods: * height = total time that the method has been executed * width = number of time the method has been executed * color = number of different receiver: white = the method has been executed on 1 receiver. black = many receivers
You can do a right-click on a method, and select viewInvocation. This opens a second view that show the execution flow. A different mapping of metrics is used: - rectangle = methods - edges = invocation (upper invokes below) - gray color = method that always return 'self'. It corresponds to void methods in Java or C++. It is therefore likely that the method performs a side effect - yellow color = method that always returns the same value for a particular object - width and height are as in the first visualization
Keep in mind that you mind encounter a freeze of your image if you instrument sensitive methods.
I would be sincerely delighted to have experience report on this.
Regards, Alexandre
-- Miguel Cobá http://miguel.leugim.com.mx
_______________________________________________ Pharo-project mailing list Pharo-project@lists.gforge.inria.fr http://lists.gforge.inria.fr/cgi-bin/mailman/listinfo/pharo-project
-- _,.;:~^~:;._,.;:~^~:;._,.;:~^~:;._,.;:~^~:;._,.;: Alexandre Bergel http://www.bergel.eu ^~:;._,.;:~^~:;._,.;:~^~:;._,.;:~^~:;._,.;:~^~:;.
_______________________________________________ Pharo-project mailing list Pharo-project@lists.gforge.inria.fr http://lists.gforge.inria.fr/cgi-bin/mailman/listinfo/pharo-project
_______________________________________________ Pharo-project mailing list Pharo-project@lists.gforge.inria.fr http://lists.gforge.inria.fr/cgi-bin/mailman/listinfo/pharo-project
_______________________________________________ Pharo-project mailing list Pharo-project@lists.gforge.inria.fr http://lists.gforge.inria.fr/cgi-bin/mailman/listinfo/pharo-project
-- _,.;:~^~:;._,.;:~^~:;._,.;:~^~:;._,.;:~^~:;._,.;: Alexandre Bergel http://www.bergel.eu ^~:;._,.;:~^~:;._,.;:~^~:;._,.;:~^~:;._,.;:~^~:;.
_______________________________________________ Pharo-project mailing list Pharo-project@lists.gforge.inria.fr http://lists.gforge.inria.fr/cgi-bin/mailman/listinfo/pharo-project
I didn't profile a real case yet, so I cannot say how useful it is for me in real life.
I would be glad to hear real life experiment.
It seems that you can quickly identify slow and often called methods (is the latter really important because if the method is often called but very fast, that's ok?!).
This is the very idea.
On the other hand, what I miss compared to message tally is to directly see the call relationship of methods. With your second view you compensate for that a bit, but with the hover tooltips, it can be cumbersome to understand a call graph.
What would be the solution? Moving the tooltip next to the all graph?
BTW, to open a class you have the O2 browser hardcoded, which did not work in my image because it was not loaded. I suggest to instead use "ToolSet browse: ... selector: ..." instead.
thanks, I fix this in Spy-Alexandre_Bergel.77. Cheers, Alexandre
On Jan 20, 2010, at 20:20 , Alexandre Bergel wrote:
Each implementor of #ensureMetacello is different. Even the one of ConfigurationOfMetacello is different from the one of the website :-)
I update ConfigurationOfSpy. It loads now without any problem.
Cheers, Alexandre
On 20 Jan 2010, at 09:16, Mariano Martinez Peck wrote:
The problem is in ConfigurationOfSpy class >> ensureMetacello
That method is wrong (it is old). You have to updated to something like this:
http://code.google.com/p/metacello/wiki/EnsureMetacello
Cheers
MAriano
On Wed, Jan 20, 2010 at 12:11 PM, Adrian Lienhard <adi@netstyle.ch> wrote: I also got the warnings and an error in the end.
Adrian
On Jan 20, 2010, at 12:06 , Alexandre Bergel wrote:
Strange, I tried in a 10505 and I got no warning. I will try later today.
Alexandre
I tried it in a PharoCore 1.0 10506 and I get a lot of deprecation warnings for gofer addPackage:, addVersion:
The method Gofer addVersion: has been deprecated. Instead of #addVersion: simply use #version:
Select Proceed to continue, or close this window to cancel the operation.
I pressed proceed and then I got:
MetacelloGoferPackage(Object)>>doesNotUnderstand: #setName.
Is this for 1.0, what version?
Cheers
To invoke the profiler, use the following template: ProfilingPackageSpy viewProfiling: [ "YOUR CODE" ] inPackage: 'YourPackageName' ProfilingPackageSpy viewProfiling: [ "YOUR CODE" ] inPackagesMatching: 'PackageName*'
Replace "YOUR CODE" by an expression. Some examples are provided
in
the class ProfilingPackageSpy (method category 'example'). You can find profilings of Mondrian, Glamour, Moose/CAnalyzer, O2. The profiling of Mondrian looks like this: -=-=-=-=-=-=-=-=-=-=-=-= ProfilingPackageSpy viewProfiling: [ | view | view := MOViewRenderer new. view nodes: (1 to: 100) forEach: [:each | view nodes: (1 to: 100)]. view root applyLayout ] inPackage: 'Mondrian' -=-=-=-=-=-=-=-=-=-=-=-=
There are two things you should keep in mind: - "YOUR CODE" will be executed twice. The first time with message Tally, then the second time with the full instrumentation. The second execution should not be impacted by the first execution. - You cannot instrument the whole image. I need more time to make this happens. Therefore, you cannot provide '*' to inPackagesMatching:
How to read the picture: - big rectangle are classes - edges represent class inheritance - inner rectangles are methods: * height = total time that the method has been executed * width = number of time the method has been executed * color = number of different receiver: white = the method has been executed on 1 receiver. black = many receivers
You can do a right-click on a method, and select viewInvocation. This opens a second view that show the execution flow. A different mapping of metrics is used: - rectangle = methods - edges = invocation (upper invokes below) - gray color = method that always return 'self'. It corresponds to void methods in Java or C++. It is therefore likely that the method performs a side effect - yellow color = method that always returns the same value for a particular object - width and height are as in the first visualization
Keep in mind that you mind encounter a freeze of your image if you instrument sensitive methods.
I would be sincerely delighted to have experience report on this.
Regards, Alexandre
-- Miguel Cobá http://miguel.leugim.com.mx
_______________________________________________ Pharo-project mailing list Pharo-project@lists.gforge.inria.fr http://lists.gforge.inria.fr/cgi-bin/mailman/listinfo/pharo- project
-- _,.;:~^~:;._,.;:~^~:;._,.;:~^~:;._,.;:~^~:;._,.;: Alexandre Bergel http://www.bergel.eu ^~:;._,.;:~^~:;._,.;:~^~:;._,.;:~^~:;._,.;:~^~:;.
_______________________________________________ Pharo-project mailing list Pharo-project@lists.gforge.inria.fr http://lists.gforge.inria.fr/cgi-bin/mailman/listinfo/pharo-project
_______________________________________________ Pharo-project mailing list Pharo-project@lists.gforge.inria.fr http://lists.gforge.inria.fr/cgi-bin/mailman/listinfo/pharo-project
_______________________________________________ Pharo-project mailing list Pharo-project@lists.gforge.inria.fr http://lists.gforge.inria.fr/cgi-bin/mailman/listinfo/pharo-project
-- _,.;:~^~:;._,.;:~^~:;._,.;:~^~:;._,.;:~^~:;._,.;: Alexandre Bergel http://www.bergel.eu ^~:;._,.;:~^~:;._,.;:~^~:;._,.;:~^~:;._,.;:~^~:;.
_______________________________________________ Pharo-project mailing list Pharo-project@lists.gforge.inria.fr http://lists.gforge.inria.fr/cgi-bin/mailman/listinfo/pharo-project
_______________________________________________ Pharo-project mailing list Pharo-project@lists.gforge.inria.fr http://lists.gforge.inria.fr/cgi-bin/mailman/listinfo/pharo-project
-- _,.;:~^~:;._,.;:~^~:;._,.;:~^~:;._,.;:~^~:;._,.;: Alexandre Bergel http://www.bergel.eu ^~:;._,.;:~^~:;._,.;:~^~:;._,.;:~^~:;._,.;:~^~:;.
A longer description of the profiler may be found on http://www.bergel.eu/download/papers/Berg10aProfiling.pdf We recently got this paper accepted. Cheers, Alexandre On 19 Jan 2010, at 22:03, Alexandre Bergel wrote:
Dear List,
Over the last few months I put some effort on a new profiler for Pharo. It has been used on a number of projects. Time has come to share it with you. To install it, just doit the following expression in a workspace (Mondrian will also be installed): -=-=-=-=-=-=-=-=-=-=-=-= Gofer new squeaksource: 'MetacelloRepository'; package: 'ConfigurationOfSpy'; load. (Smalltalk at: #ConfigurationOfSpy) perform: #loadDefault -=-=-=-=-=-=-=-=-=-=-=-=
To invoke the profiler, use the following template: ProfilingPackageSpy viewProfiling: [ "YOUR CODE" ] inPackage: 'YourPackageName' ProfilingPackageSpy viewProfiling: [ "YOUR CODE" ] inPackagesMatching: 'PackageName*'
Replace "YOUR CODE" by an expression. Some examples are provided in the class ProfilingPackageSpy (method category 'example'). You can find profilings of Mondrian, Glamour, Moose/CAnalyzer, O2. The profiling of Mondrian looks like this: -=-=-=-=-=-=-=-=-=-=-=-= ProfilingPackageSpy viewProfiling: [ | view | view := MOViewRenderer new. view nodes: (1 to: 100) forEach: [:each | view nodes: (1 to: 100)]. view root applyLayout ] inPackage: 'Mondrian' -=-=-=-=-=-=-=-=-=-=-=-=
There are two things you should keep in mind: - "YOUR CODE" will be executed twice. The first time with message Tally, then the second time with the full instrumentation. The second execution should not be impacted by the first execution. - You cannot instrument the whole image. I need more time to make this happens. Therefore, you cannot provide '*' to inPackagesMatching:
How to read the picture: - big rectangle are classes - edges represent class inheritance - inner rectangles are methods: * height = total time that the method has been executed * width = number of time the method has been executed * color = number of different receiver: white = the method has been executed on 1 receiver. black = many receivers
You can do a right-click on a method, and select viewInvocation. This opens a second view that show the execution flow. A different mapping of metrics is used: - rectangle = methods - edges = invocation (upper invokes below) - gray color = method that always return 'self'. It corresponds to void methods in Java or C++. It is therefore likely that the method performs a side effect - yellow color = method that always returns the same value for a particular object - width and height are as in the first visualization
Keep in mind that you mind encounter a freeze of your image if you instrument sensitive methods.
I would be sincerely delighted to have experience report on this.
Regards, Alexandre
-- _,.;:~^~:;._,.;:~^~:;._,.;:~^~:;._,.;:~^~:;._,.;: Alexandre Bergel http://www.bergel.eu ^~:;._,.;:~^~:;._,.;:~^~:;._,.;:~^~:;._,.;:~^~:;.
_______________________________________________ Pharo-project mailing list Pharo-project@lists.gforge.inria.fr http://lists.gforge.inria.fr/cgi-bin/mailman/listinfo/pharo-project
-- _,.;:~^~:;._,.;:~^~:;._,.;:~^~:;._,.;:~^~:;._,.;: Alexandre Bergel http://www.bergel.eu ^~:;._,.;:~^~:;._,.;:~^~:;._,.;:~^~:;._,.;:~^~:;.
participants (8)
-
 Adrian Lienhard
 -
 Alexandre Bergel
 -
 Alexandre Bergel
 -
 John M McIntosh
 -
John McIntosh
-
 Levente Uzonyi
 -
 Mariano Martinez Peck
 -
 Miguel Enrique Cobá Martinez