
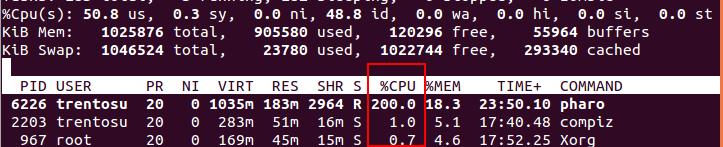
I am running a data migration, which involves some in-memory computation and heavy database i/o. Looking at how intensive this was the CPU use indicated by 'top' is 200% , I've seen percentages over 100% before, things like 107%... How is this possible? I'm running the pharo inside a VMWare machine with 2 cores. The good thing is that even with such high CPU, I forked the execution at userBackgroundPriority and the UI remained responsive. After this CPU intensive task took place, the vm got back to the "insidious" ~5% CPU idle state. :) Esteban A. Maringolo

Load on a unix machine is more or less a count of how many processes are waiting for IO, so you will see high numbers when doing lot's of IO. This way you can go loads many multiples of 100%. On a multicore machine, N x 100% is normal as a CPU maximum. My laptop has 4 cores and can show 400% load when doing something highly parallel. It is good that the load came back down to normal ;-) On 19 May 2014, at 16:54, Esteban A. Maringolo <emaringolo@gmail.com> wrote:
I am running a data migration, which involves some in-memory computation and heavy database i/o. Looking at how intensive this was the CPU use indicated by 'top' is 200% , I've seen percentages over 100% before, things like 107%...
How is this possible?
I'm running the pharo inside a VMWare machine with 2 cores.
The good thing is that even with such high CPU, I forked the execution at userBackgroundPriority and the UI remained responsive.
After this CPU intensive task took place, the vm got back to the "insidious" ~5% CPU idle state. :)
Esteban A. Maringolo <pharoCpu.png>

Am 19.05.2014 um 17:03 schrieb Sven Van Caekenberghe <sven@stfx.eu>:
Load on a unix machine is more or less a count of how many processes are waiting for IO, so you will see high numbers when doing lot's of IO. This way you can go loads many multiples of 100%.
I think it needs an explanation if this happens to a single threaded (single OS process) application, right? Iâm not sure how FFI or certain native things are handled. But for the virtual machine solely it shouldnât be possible to go over 100%. Norbert
On a multicore machine, N x 100% is normal as a CPU maximum. My laptop has 4 cores and can show 400% load when doing something highly parallel.
It is good that the load came back down to normal ;-)
On 19 May 2014, at 16:54, Esteban A. Maringolo <emaringolo@gmail.com> wrote:
I am running a data migration, which involves some in-memory computation and heavy database i/o. Looking at how intensive this was the CPU use indicated by 'top' is 200% , I've seen percentages over 100% before, things like 107%...
How is this possible?
I'm running the pharo inside a VMWare machine with 2 cores.
The good thing is that even with such high CPU, I forked the execution at userBackgroundPriority and the UI remained responsive.
After this CPU intensive task took place, the vm got back to the "insidious" ~5% CPU idle state. :)
Esteban A. Maringolo <pharoCpu.png>
2014-05-19 12:03 GMT-03:00 Sven Van Caekenberghe <sven@stfx.eu>:
Load on a unix machine is more or less a count of how many processes are waiting for IO, so you will see high numbers when doing lot's of IO. This way you can go loads many multiples of 100%. On a multicore machine, N x 100% is normal as a CPU maximum. My laptop has 4 cores and can show 400% load when doing something highly parallel.
I didn't know that. My CPU has 4 cores too, but the vm only two. I guess the database sockets increase this IO count and causes such high cpu use. What is the way to measure the "real" cpu use of the pharo-vm?
It is good that the load came back down to normal ;-)
I wish idle was 0%, but 5% is totally acceptable given how stable it is. Thank you Sven. Esteban A. Maringolo
Am 19.05.2014 um 17:37 schrieb Esteban A. Maringolo <emaringolo@gmail.com>:
2014-05-19 12:03 GMT-03:00 Sven Van Caekenberghe <sven@stfx.eu>:
Load on a unix machine is more or less a count of how many processes are waiting for IO, so you will see high numbers when doing lot's of IO. This way you can go loads many multiples of 100%. On a multicore machine, N x 100% is normal as a CPU maximum. My laptop has 4 cores and can show 400% load when doing something highly parallel.
I didn't know that. My CPU has 4 cores too, but the vm only two. I guess the database sockets increase this IO count and causes such high cpu use.
What is the way to measure the "real" cpu use of the pharo-vm?
On linux use $ ps -eo %cpu,command Norbert
It is good that the load came back down to normal ;-)
I wish idle was 0%, but 5% is totally acceptable given how stable it is.
Thank you Sven.
Esteban A. Maringolo

2014-05-19 17:37 GMT+02:00 Esteban A. Maringolo <emaringolo@gmail.com>:
2014-05-19 12:03 GMT-03:00 Sven Van Caekenberghe <sven@stfx.eu>:
Load on a unix machine is more or less a count of how many processes are waiting for IO, so you will see high numbers when doing lot's of IO. This way you can go loads many multiples of 100%. On a multicore machine, N x 100% is normal as a CPU maximum. My laptop has 4 cores and can show 400% load when doing something highly parallel.
I didn't know that. My CPU has 4 cores too, but the vm only two. I guess the database sockets increase this IO count and causes such high cpu use.
What is the way to measure the "real" cpu use of the pharo-vm?
It is good that the load came back down to normal ;-)
I wish idle was 0%, but 5% is totally acceptable given how stable it is.
I would love to have that. If someone has a few months to spend in the Scheduler ... Note that with the new non blocking FFI implementation (I don't know when it will be in production, the 64 bits port became more important than non blocking FFI, so we inverted the priorities, probably in a year or 2), the VM could show more than 100% cpu usage if using FFI.
Thank you Sven.
Esteban A. Maringolo
participants (4)
-
 Clément Bera
 -
 Esteban A. Maringolo
 -
 Norbert Hartl
 -
 Sven Van Caekenberghe